Zip Codes with the Highest Percentage of Households Without a Vehicle in Hopkins, MN
RELATED REPORTS & OPTIONS
Households without a Cars
Hopkins
Compare Zip Codes
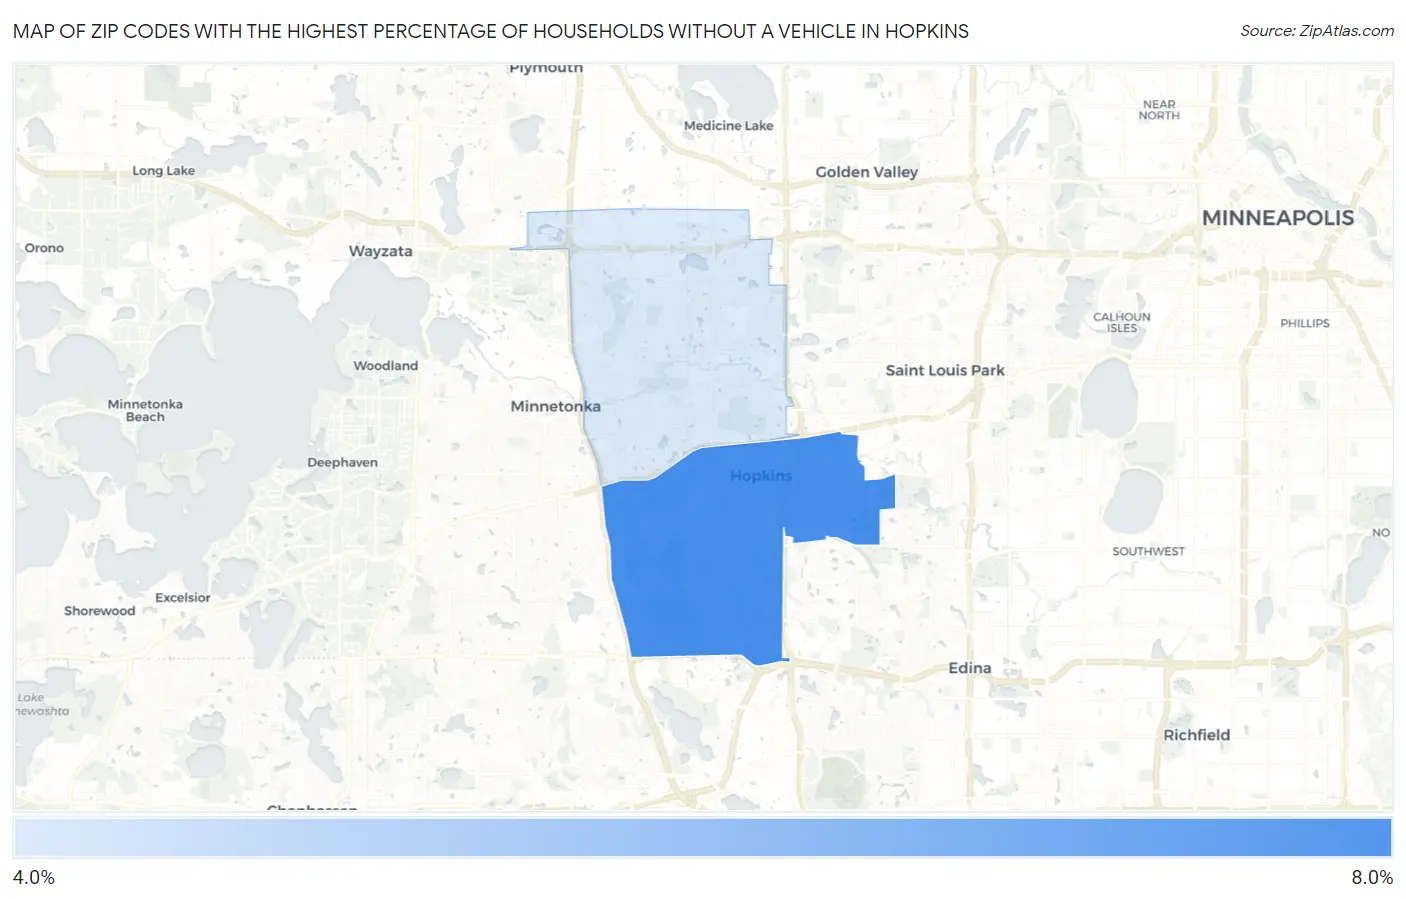
Map of Zip Codes with the Highest Percentage of Households Without a Vehicle in Hopkins
4.8%
7.9%
Zip Codes with the Highest Percentage of Households Without a Vehicle in Hopkins, MN
| Zip Code | Housholds Without a Car | vs State | vs National | |
| 1. | 55343 | 7.9% | 6.6%(+1.30)#134 | 8.3%(-0.400)#7,092 |
| 2. | 55305 | 4.8% | 6.6%(-1.80)#316 | 8.3%(-3.50)#13,388 |
1
Common Questions
What are the Top Zip Codes with the Highest Percentage of Households Without a Vehicle in Hopkins, MN?
Top Zip Codes with the Highest Percentage of Households Without a Vehicle in Hopkins, MN are:
What zip code has the Highest Percentage of Households Without a Vehicle in Hopkins, MN?
55343 has the Highest Percentage of Households Without a Vehicle in Hopkins, MN with 7.9%.
What is the Percentage of Households Without a Vehicle in Hopkins, MN?
Percentage of Households Without a Vehicle in Hopkins is 11.1%.
What is the Percentage of Households Without a Vehicle in Minnesota?
Percentage of Households Without a Vehicle in Minnesota is 6.6%.
What is the Percentage of Households Without a Vehicle in the United States?
Percentage of Households Without a Vehicle in the United States is 8.3%.