Zip Codes with the Highest Percentage of Population Taking Taxi / Cab to Work in Burton, MI
RELATED REPORTS & OPTIONS
Taxi / Cab
Burton
Compare Zip Codes
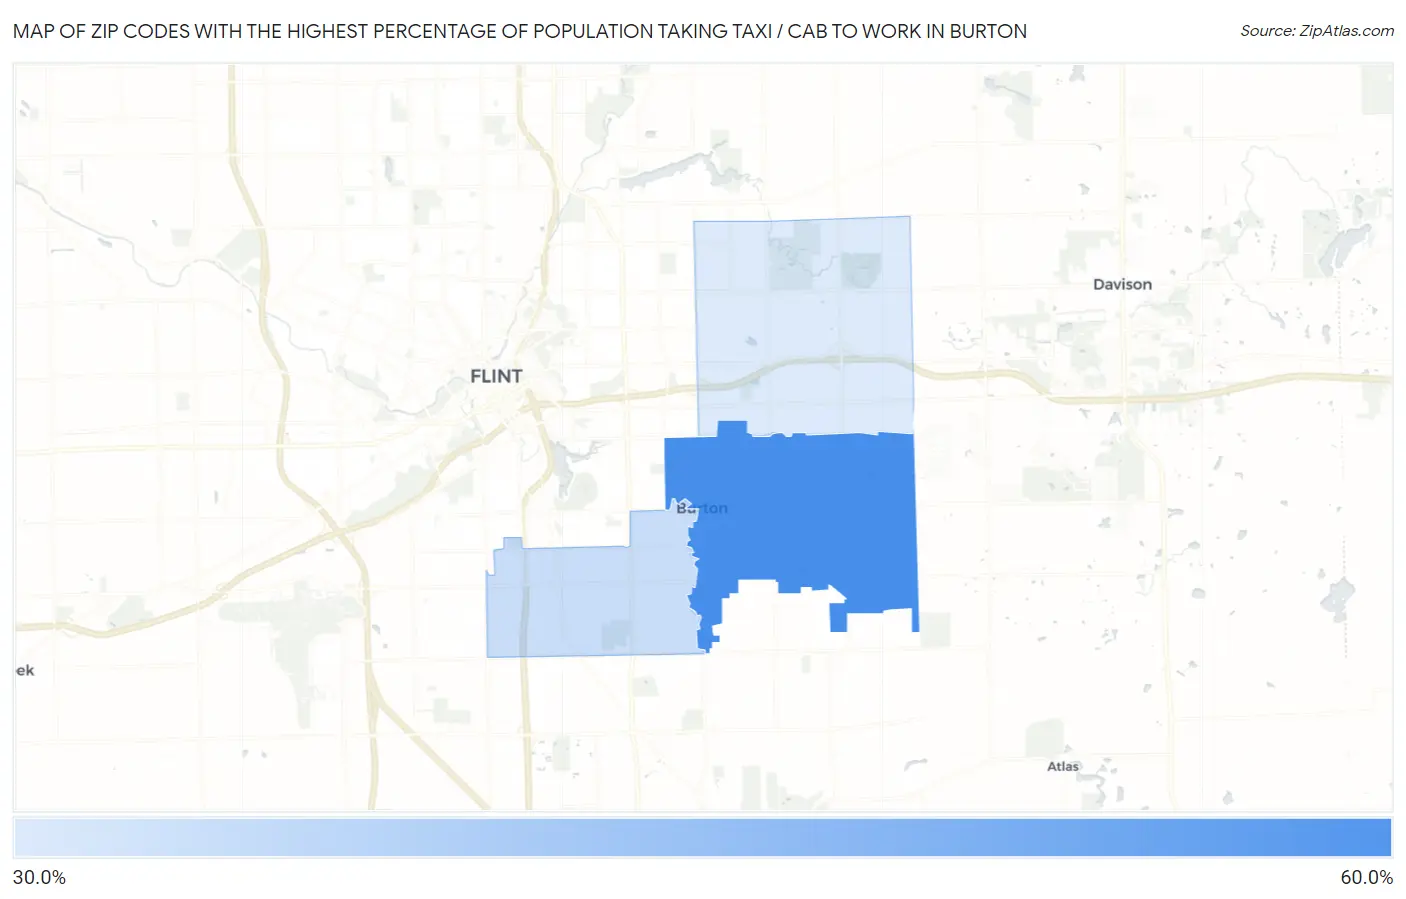
Map of Zip Codes with the Highest Percentage of Population Taking Taxi / Cab to Work in Burton
32.6%
50.3%
Zip Codes with the Highest Percentage of Population Taking Taxi / Cab to Work in Burton, MI
| Zip Code | % Take Taxi / Cab | vs State | vs National | |
| 1. | 48519 | 50.3% | 36.2%(+14.1)#115 | 38.2%(+12.1)#2,876 |
| 2. | 48529 | 35.0% | 36.2%(-1.20)#339 | 38.2%(-3.20)#8,898 |
| 3. | 48509 | 32.6% | 36.2%(-3.60)#363 | 38.2%(-5.60)#9,968 |
1
Common Questions
What are the Top Zip Codes with the Highest Percentage of Population Taking Taxi / Cab to Work in Burton, MI?
Top Zip Codes with the Highest Percentage of Population Taking Taxi / Cab to Work in Burton, MI are:
What zip code has the Highest Percentage of Population Taking Taxi / Cab to Work in Burton, MI?
48519 has the Highest Percentage of Population Taking Taxi / Cab to Work in Burton, MI with 50.3%.
What is the Percentage of Population Taking Taxi / Cab to Work in Burton, MI?
Percentage of Population Taking Taxi / Cab to Work in Burton is 34.5%.
What is the Percentage of Population Taking Taxi / Cab to Work in Michigan?
Percentage of Population Taking Taxi / Cab to Work in Michigan is 36.2%.
What is the Percentage of Population Taking Taxi / Cab to Work in the United States?
Percentage of Population Taking Taxi / Cab to Work in the United States is 38.2%.