Zip Codes with the Highest Percentage of Population with a Degree in Visual and Performing Arts in Clarkston, MI
RELATED REPORTS & OPTIONS
Visual and Performing Arts
Clarkston
Compare Zip Codes
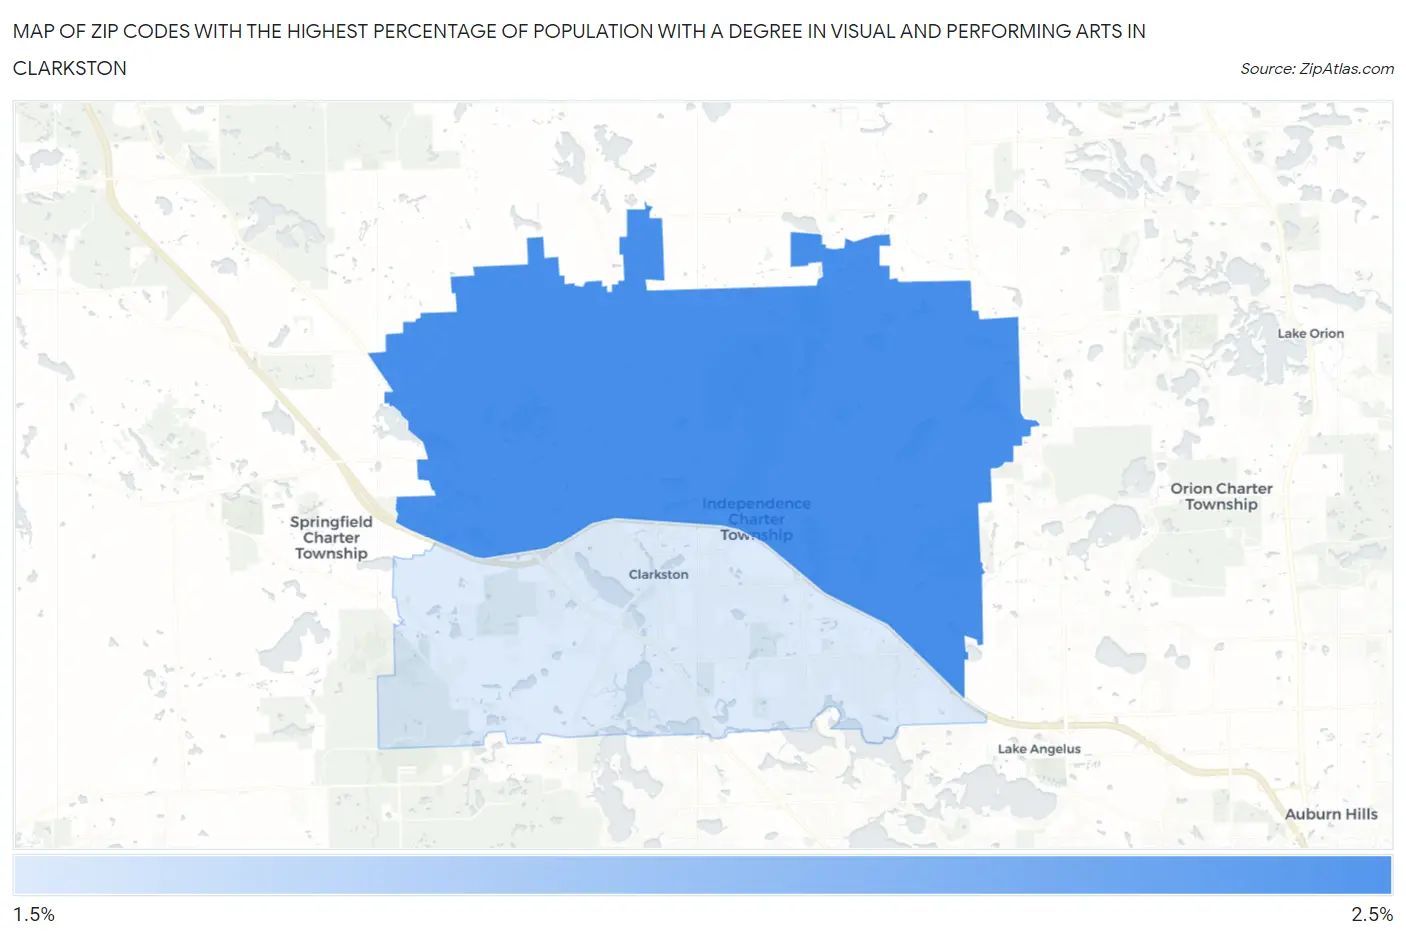
Map of Zip Codes with the Highest Percentage of Population with a Degree in Visual and Performing Arts in Clarkston
2.1%
2.3%
Zip Codes with the Highest Percentage of Population with a Degree in Visual and Performing Arts in Clarkston, MI
| Zip Code | % Graduates | vs State | vs National | |
| 1. | 48348 | 2.3% | 3.4%(-1.06)#483 | 4.3%(-1.91)#15,216 |
| 2. | 48346 | 2.1% | 3.4%(-1.33)#526 | 4.3%(-2.18)#16,177 |
1
Common Questions
What are the Top Zip Codes with the Highest Percentage of Population with a Degree in Visual and Performing Arts in Clarkston, MI?
Top Zip Codes with the Highest Percentage of Population with a Degree in Visual and Performing Arts in Clarkston, MI are:
What zip code has the Highest Percentage of Population with a Degree in Visual and Performing Arts in Clarkston, MI?
48348 has the Highest Percentage of Population with a Degree in Visual and Performing Arts in Clarkston, MI with 2.3%.
What is the Percentage of Population with a Degree in Visual and Performing Arts in Michigan?
Percentage of Population with a Degree in Visual and Performing Arts in Michigan is 3.4%.
What is the Percentage of Population with a Degree in Visual and Performing Arts in the United States?
Percentage of Population with a Degree in Visual and Performing Arts in the United States is 4.3%.