Zip Codes with the Highest Percentage of Population with a Degree in Visual and Performing Arts in Midland, MI
RELATED REPORTS & OPTIONS
Visual and Performing Arts
Midland
Compare Zip Codes
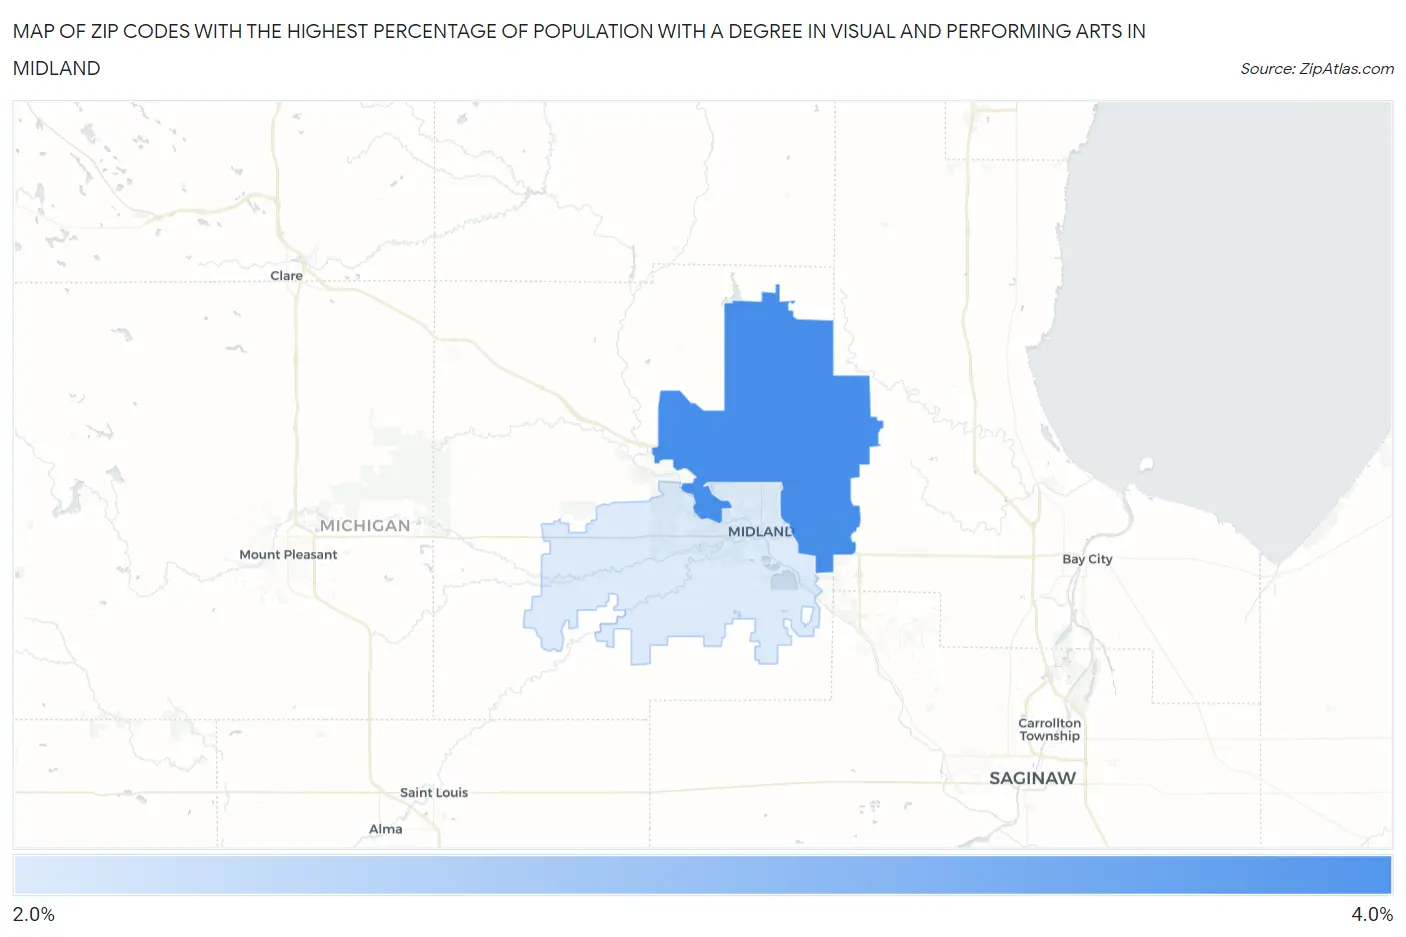
Map of Zip Codes with the Highest Percentage of Population with a Degree in Visual and Performing Arts in Midland
2.7%
3.2%
Zip Codes with the Highest Percentage of Population with a Degree in Visual and Performing Arts in Midland, MI
| Zip Code | % Graduates | vs State | vs National | |
| 1. | 48642 | 3.2% | 3.4%(-0.250)#351 | 4.3%(-1.10)#12,150 |
| 2. | 48640 | 2.7% | 3.4%(-0.708)#422 | 4.3%(-1.56)#13,930 |
1
Common Questions
What are the Top Zip Codes with the Highest Percentage of Population with a Degree in Visual and Performing Arts in Midland, MI?
Top Zip Codes with the Highest Percentage of Population with a Degree in Visual and Performing Arts in Midland, MI are:
What zip code has the Highest Percentage of Population with a Degree in Visual and Performing Arts in Midland, MI?
48642 has the Highest Percentage of Population with a Degree in Visual and Performing Arts in Midland, MI with 3.2%.
What is the Percentage of Population with a Degree in Visual and Performing Arts in Midland, MI?
Percentage of Population with a Degree in Visual and Performing Arts in Midland is 2.8%.
What is the Percentage of Population with a Degree in Visual and Performing Arts in Michigan?
Percentage of Population with a Degree in Visual and Performing Arts in Michigan is 3.4%.
What is the Percentage of Population with a Degree in Visual and Performing Arts in the United States?
Percentage of Population with a Degree in Visual and Performing Arts in the United States is 4.3%.