Zip Codes with the Highest Percentage of Population with a Degree in Visual and Performing Arts in Clinton Township, MI
RELATED REPORTS & OPTIONS
Visual and Performing Arts
Clinton Township
Compare Zip Codes
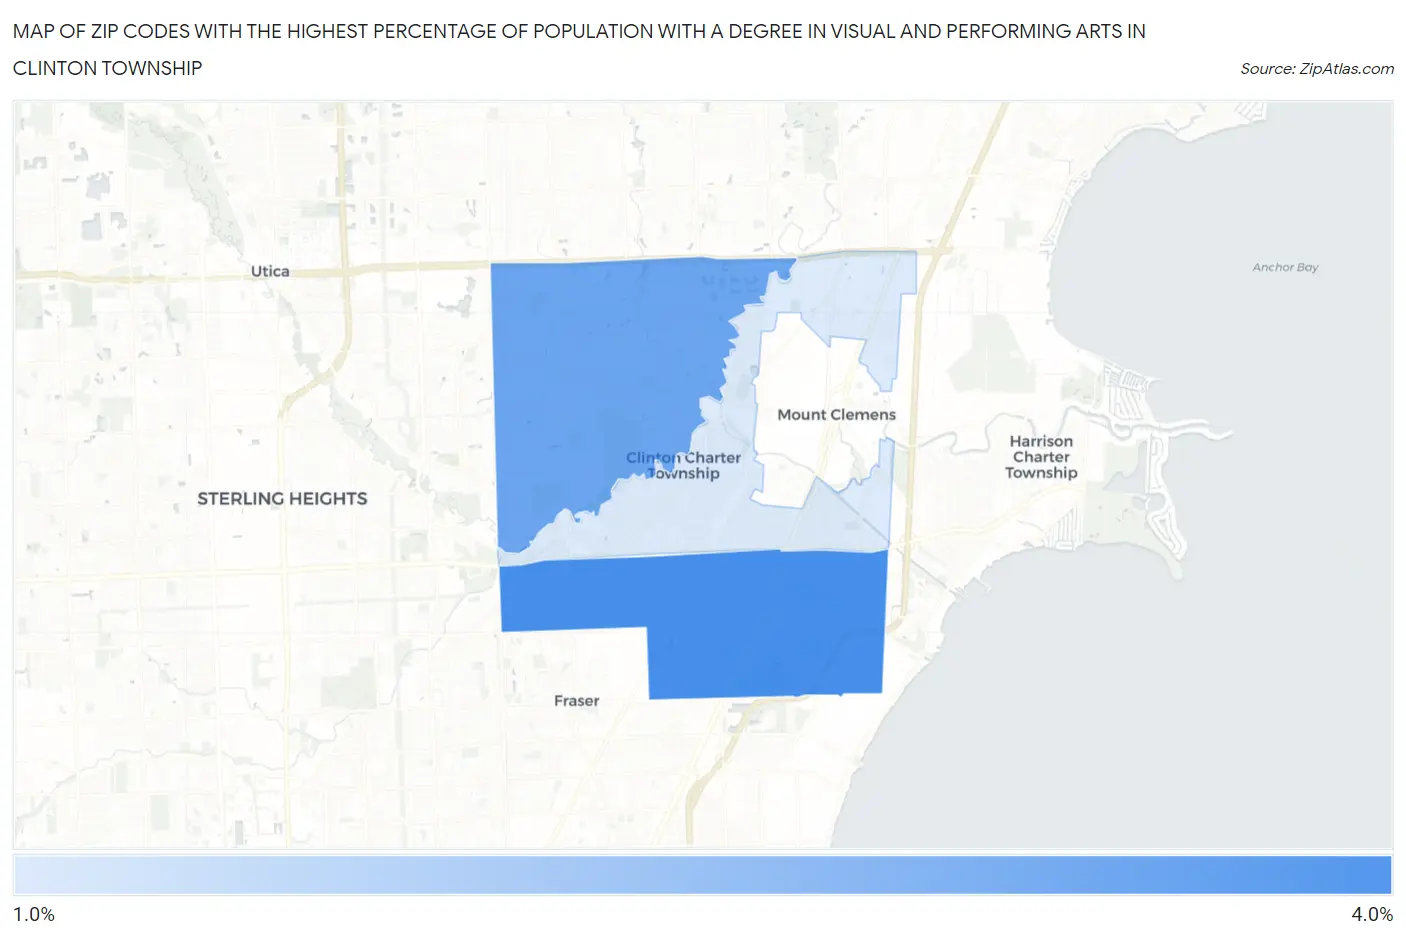
Map of Zip Codes with the Highest Percentage of Population with a Degree in Visual and Performing Arts in Clinton Township
1.5%
3.1%
Zip Codes with the Highest Percentage of Population with a Degree in Visual and Performing Arts in Clinton Township, MI
| Zip Code | % Graduates | vs State | vs National | |
| 1. | 48035 | 3.1% | 3.4%(-0.322)#355 | 4.3%(-1.17)#12,409 |
| 2. | 48038 | 2.7% | 3.4%(-0.724)#426 | 4.3%(-1.57)#13,986 |
| 3. | 48036 | 1.5% | 3.4%(-1.94)#644 | 4.3%(-2.79)#18,280 |
1
Common Questions
What are the Top Zip Codes with the Highest Percentage of Population with a Degree in Visual and Performing Arts in Clinton Township, MI?
Top Zip Codes with the Highest Percentage of Population with a Degree in Visual and Performing Arts in Clinton Township, MI are:
What zip code has the Highest Percentage of Population with a Degree in Visual and Performing Arts in Clinton Township, MI?
48035 has the Highest Percentage of Population with a Degree in Visual and Performing Arts in Clinton Township, MI with 3.1%.
What is the Percentage of Population with a Degree in Visual and Performing Arts in Michigan?
Percentage of Population with a Degree in Visual and Performing Arts in Michigan is 3.4%.
What is the Percentage of Population with a Degree in Visual and Performing Arts in the United States?
Percentage of Population with a Degree in Visual and Performing Arts in the United States is 4.3%.