Zip Codes with the Highest Percentage of Population with a Degree in Visual and Performing Arts in Holland, MI
RELATED REPORTS & OPTIONS
Visual and Performing Arts
Holland
Compare Zip Codes
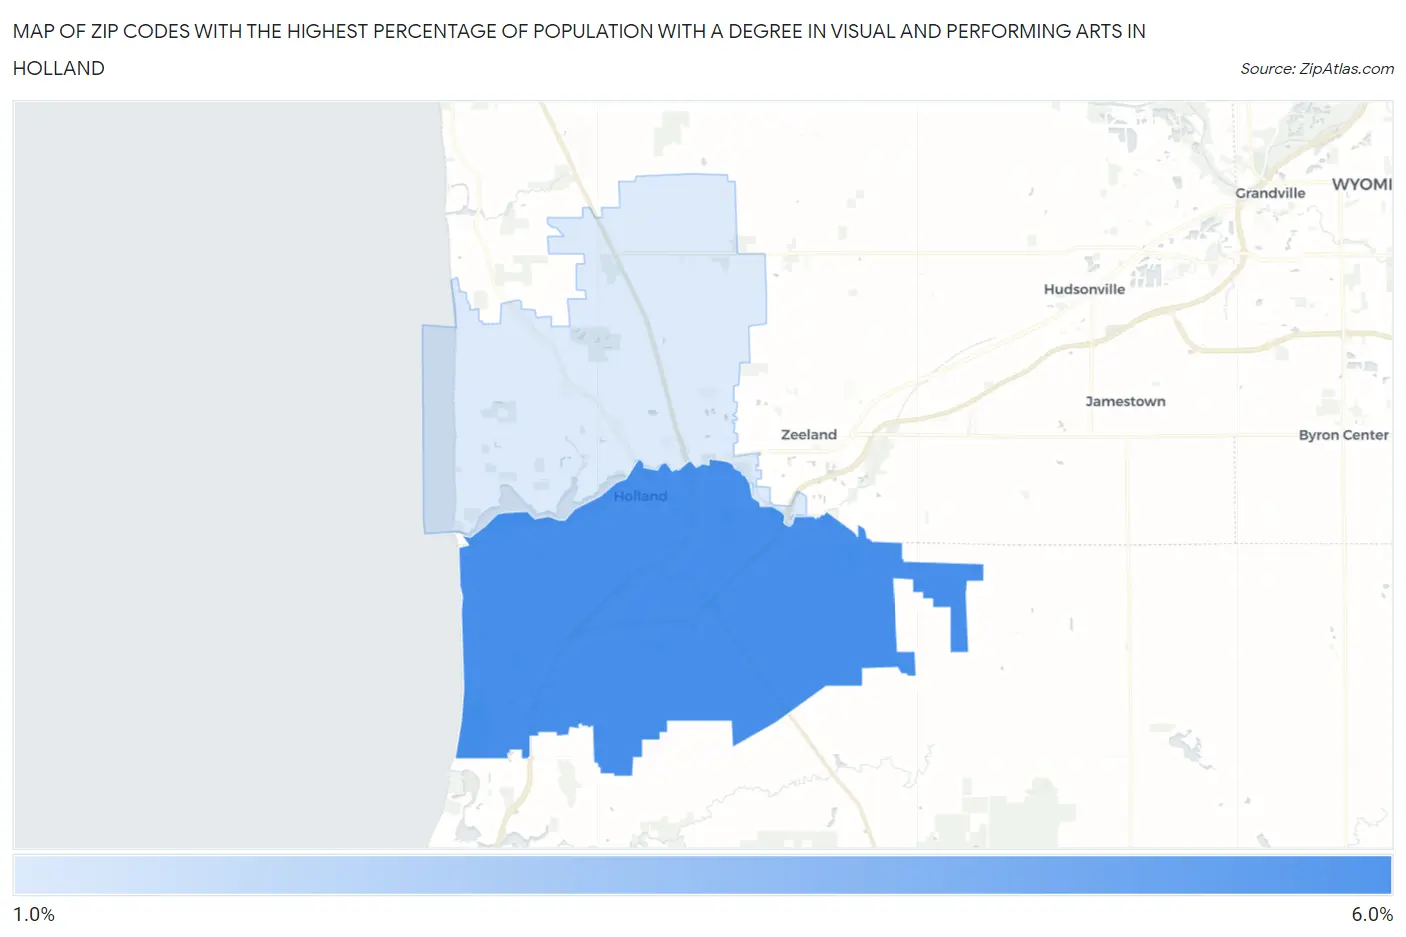
Map of Zip Codes with the Highest Percentage of Population with a Degree in Visual and Performing Arts in Holland
1.8%
5.2%
Zip Codes with the Highest Percentage of Population with a Degree in Visual and Performing Arts in Holland, MI
| Zip Code | % Graduates | vs State | vs National | |
| 1. | 49423 | 5.2% | 3.4%(+1.78)#155 | 4.3%(+0.929)#6,280 |
| 2. | 49424 | 1.8% | 3.4%(-1.59)#579 | 4.3%(-2.44)#17,116 |
1
Common Questions
What are the Top Zip Codes with the Highest Percentage of Population with a Degree in Visual and Performing Arts in Holland, MI?
Top Zip Codes with the Highest Percentage of Population with a Degree in Visual and Performing Arts in Holland, MI are:
What zip code has the Highest Percentage of Population with a Degree in Visual and Performing Arts in Holland, MI?
49423 has the Highest Percentage of Population with a Degree in Visual and Performing Arts in Holland, MI with 5.2%.
What is the Percentage of Population with a Degree in Visual and Performing Arts in Holland, MI?
Percentage of Population with a Degree in Visual and Performing Arts in Holland is 6.3%.
What is the Percentage of Population with a Degree in Visual and Performing Arts in Michigan?
Percentage of Population with a Degree in Visual and Performing Arts in Michigan is 3.4%.
What is the Percentage of Population with a Degree in Visual and Performing Arts in the United States?
Percentage of Population with a Degree in Visual and Performing Arts in the United States is 4.3%.