Zip Codes with the Highest Percentage of Population with a Degree in Visual and Performing Arts in Farmington, MI
RELATED REPORTS & OPTIONS
Visual and Performing Arts
Farmington
Compare Zip Codes
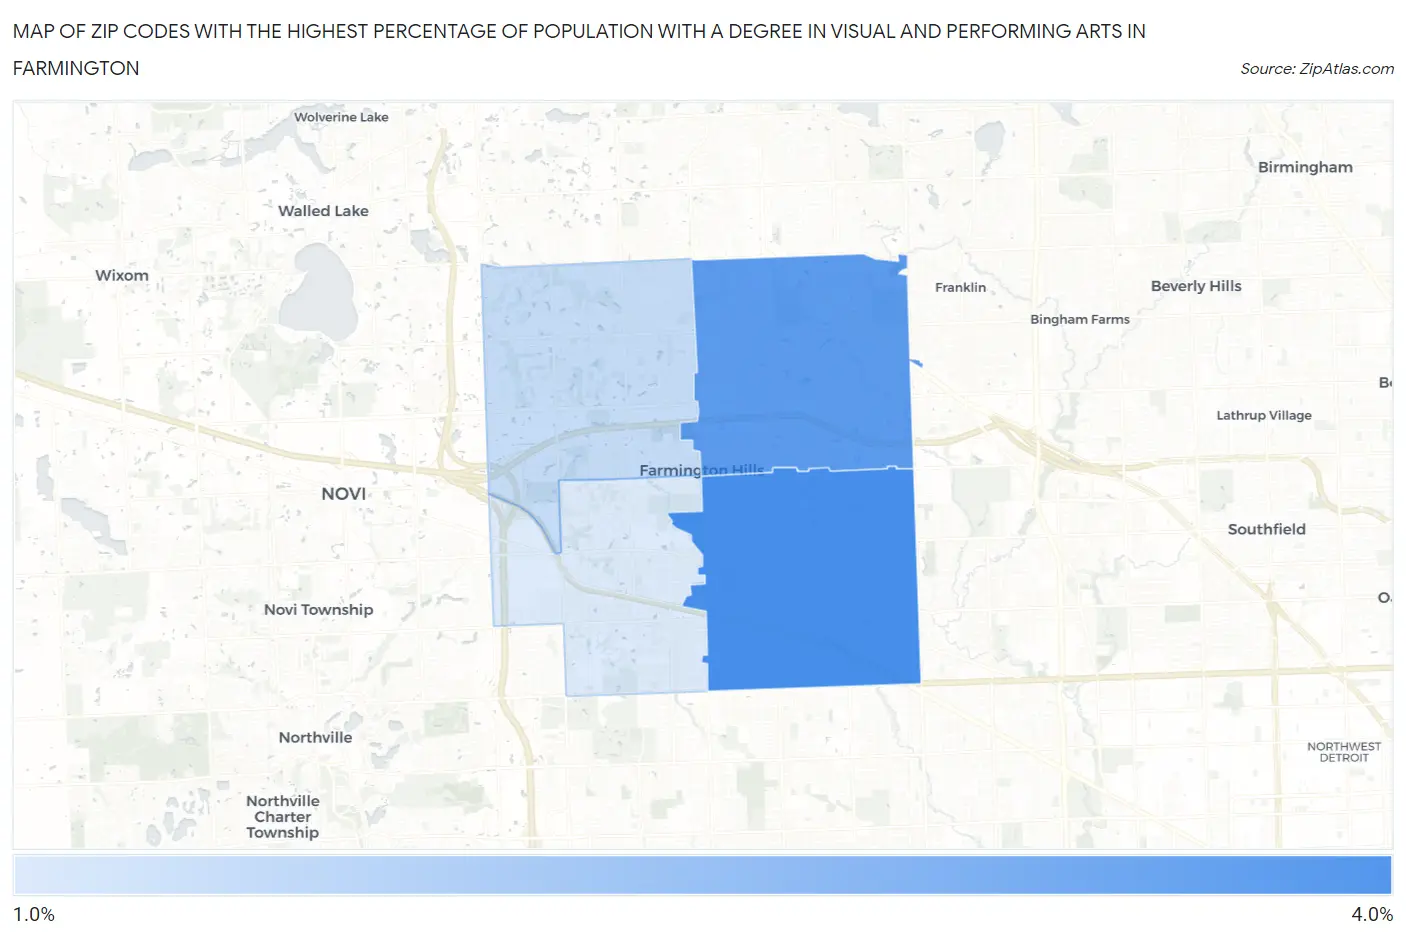
Map of Zip Codes with the Highest Percentage of Population with a Degree in Visual and Performing Arts in Farmington
1.7%
3.6%
Zip Codes with the Highest Percentage of Population with a Degree in Visual and Performing Arts in Farmington, MI
| Zip Code | % Graduates | vs State | vs National | |
| 1. | 48336 | 3.6% | 3.4%(+0.183)#290 | 4.3%(-0.667)#10,546 |
| 2. | 48334 | 3.3% | 3.4%(-0.088)#329 | 4.3%(-0.938)#11,548 |
| 3. | 48331 | 2.0% | 3.4%(-1.45)#553 | 4.3%(-2.30)#16,601 |
| 4. | 48335 | 1.7% | 3.4%(-1.74)#604 | 4.3%(-2.59)#17,619 |
1
Common Questions
What are the Top 3 Zip Codes with the Highest Percentage of Population with a Degree in Visual and Performing Arts in Farmington, MI?
Top 3 Zip Codes with the Highest Percentage of Population with a Degree in Visual and Performing Arts in Farmington, MI are:
What zip code has the Highest Percentage of Population with a Degree in Visual and Performing Arts in Farmington, MI?
48336 has the Highest Percentage of Population with a Degree in Visual and Performing Arts in Farmington, MI with 3.6%.
What is the Percentage of Population with a Degree in Visual and Performing Arts in Farmington, MI?
Percentage of Population with a Degree in Visual and Performing Arts in Farmington is 2.8%.
What is the Percentage of Population with a Degree in Visual and Performing Arts in Michigan?
Percentage of Population with a Degree in Visual and Performing Arts in Michigan is 3.4%.
What is the Percentage of Population with a Degree in Visual and Performing Arts in the United States?
Percentage of Population with a Degree in Visual and Performing Arts in the United States is 4.3%.