Zip Codes with the Highest Percentage of Population Employed in Security & Protection in Northampton, MA
RELATED REPORTS & OPTIONS
Security & Protection
Northampton
Compare Zip Codes
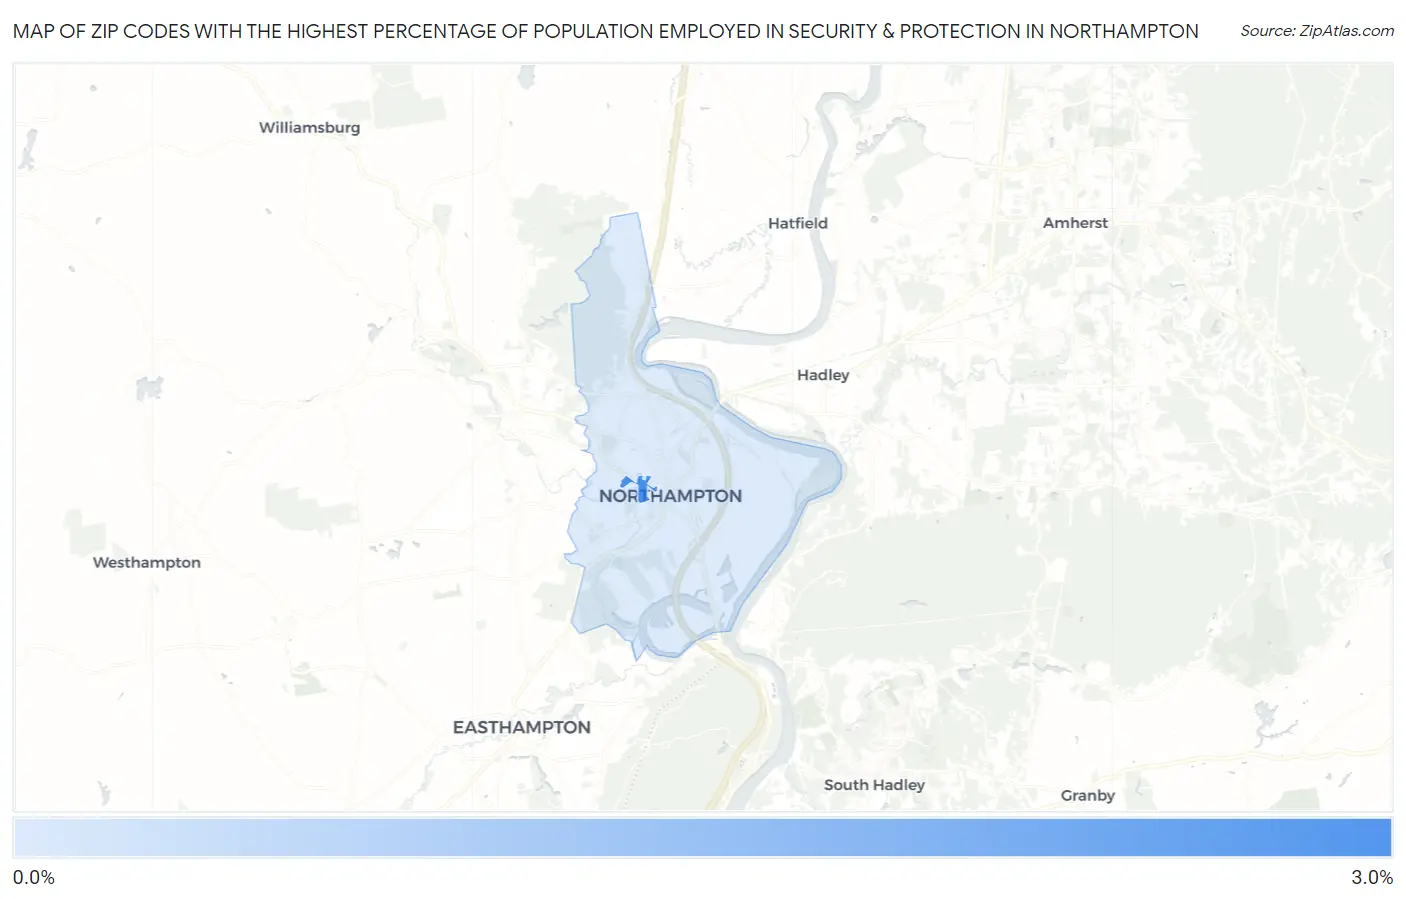
Map of Zip Codes with the Highest Percentage of Population Employed in Security & Protection in Northampton
0.86%
2.7%
Zip Codes with the Highest Percentage of Population Employed in Security & Protection in Northampton, MA
| Zip Code | % Employed | vs State | vs National | |
| 1. | 01063 | 2.7% | 2.0%(+0.673)#123 | 2.1%(+0.538)#8,598 |
| 2. | 01060 | 0.86% | 2.0%(-1.16)#382 | 2.1%(-1.29)#21,049 |
1
Common Questions
What are the Top Zip Codes with the Highest Percentage of Population Employed in Security & Protection in Northampton, MA?
Top Zip Codes with the Highest Percentage of Population Employed in Security & Protection in Northampton, MA are:
What zip code has the Highest Percentage of Population Employed in Security & Protection in Northampton, MA?
01063 has the Highest Percentage of Population Employed in Security & Protection in Northampton, MA with 2.7%.
What is the Percentage of Population Employed in Security & Protection in Northampton, MA?
Percentage of Population Employed in Security & Protection in Northampton is 1.4%.
What is the Percentage of Population Employed in Security & Protection in Massachusetts?
Percentage of Population Employed in Security & Protection in Massachusetts is 2.0%.
What is the Percentage of Population Employed in Security & Protection in the United States?
Percentage of Population Employed in Security & Protection in the United States is 2.1%.