Zip Codes with the Highest Percentage of Population Employed in Security & Protection in Quincy, MA
RELATED REPORTS & OPTIONS
Security & Protection
Quincy
Compare Zip Codes
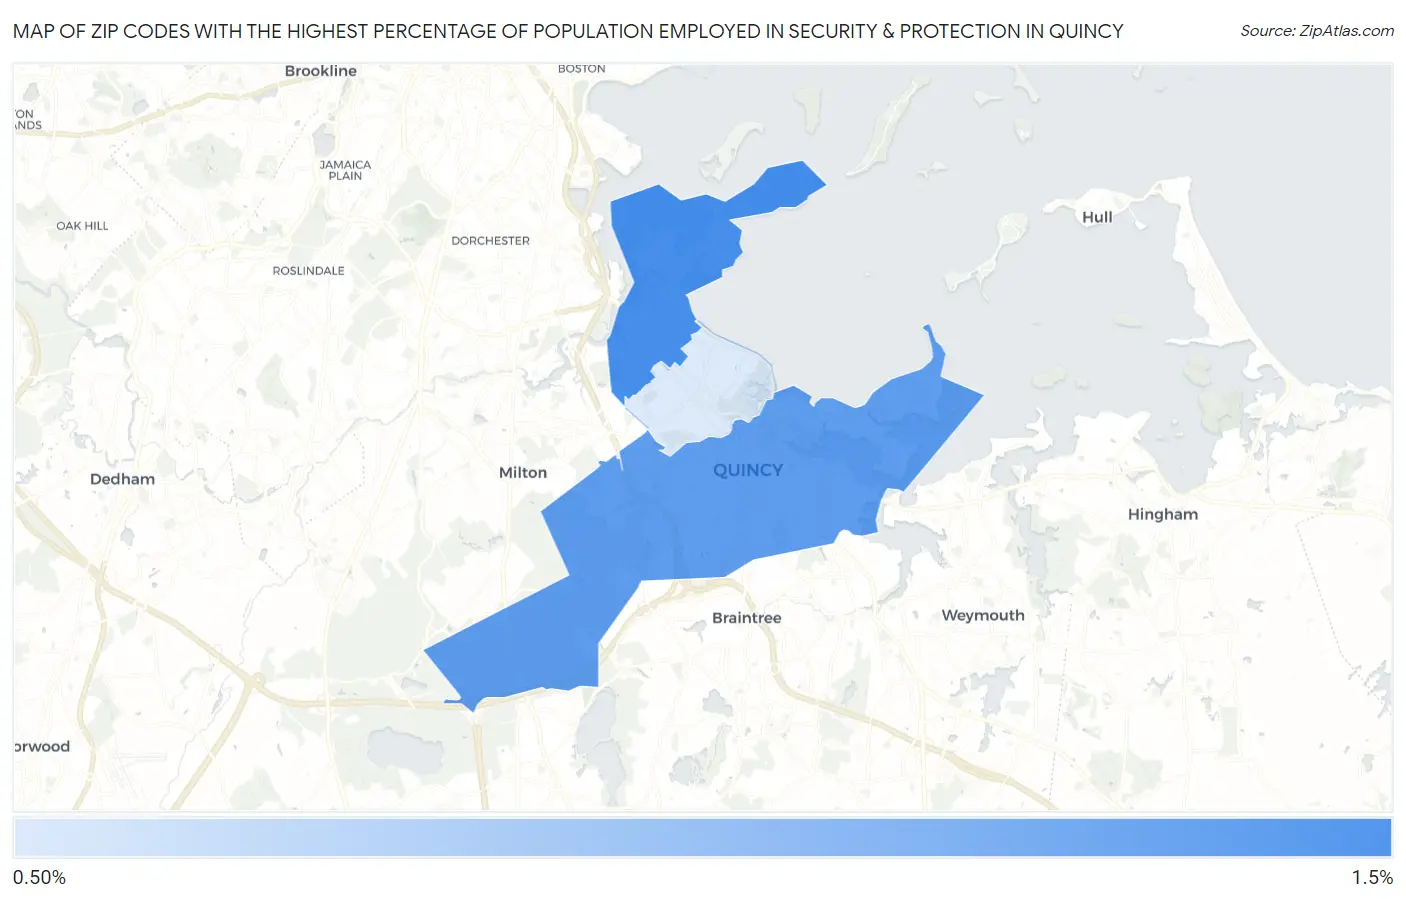
Map of Zip Codes with the Highest Percentage of Population Employed in Security & Protection in Quincy
0.72%
1.3%
Zip Codes with the Highest Percentage of Population Employed in Security & Protection in Quincy, MA
| Zip Code | % Employed | vs State | vs National | |
| 1. | 02171 | 1.3% | 2.0%(-0.691)#313 | 2.1%(-0.825)#17,551 |
| 2. | 02169 | 1.2% | 2.0%(-0.780)#332 | 2.1%(-0.914)#18,253 |
| 3. | 02170 | 0.72% | 2.0%(-1.29)#402 | 2.1%(-1.43)#21,916 |
1
Common Questions
What are the Top Zip Codes with the Highest Percentage of Population Employed in Security & Protection in Quincy, MA?
Top Zip Codes with the Highest Percentage of Population Employed in Security & Protection in Quincy, MA are:
What zip code has the Highest Percentage of Population Employed in Security & Protection in Quincy, MA?
02171 has the Highest Percentage of Population Employed in Security & Protection in Quincy, MA with 1.3%.
What is the Percentage of Population Employed in Security & Protection in Quincy, MA?
Percentage of Population Employed in Security & Protection in Quincy is 1.1%.
What is the Percentage of Population Employed in Security & Protection in Massachusetts?
Percentage of Population Employed in Security & Protection in Massachusetts is 2.0%.
What is the Percentage of Population Employed in Security & Protection in the United States?
Percentage of Population Employed in Security & Protection in the United States is 2.1%.