Zip Codes with the Most Immigrants from Asia in Northampton, MA
RELATED REPORTS & OPTIONS
Asia
Northampton
Compare Zip Codes
Map of Zip Codes with the Most Immigrants from Asia in Northampton
328
387
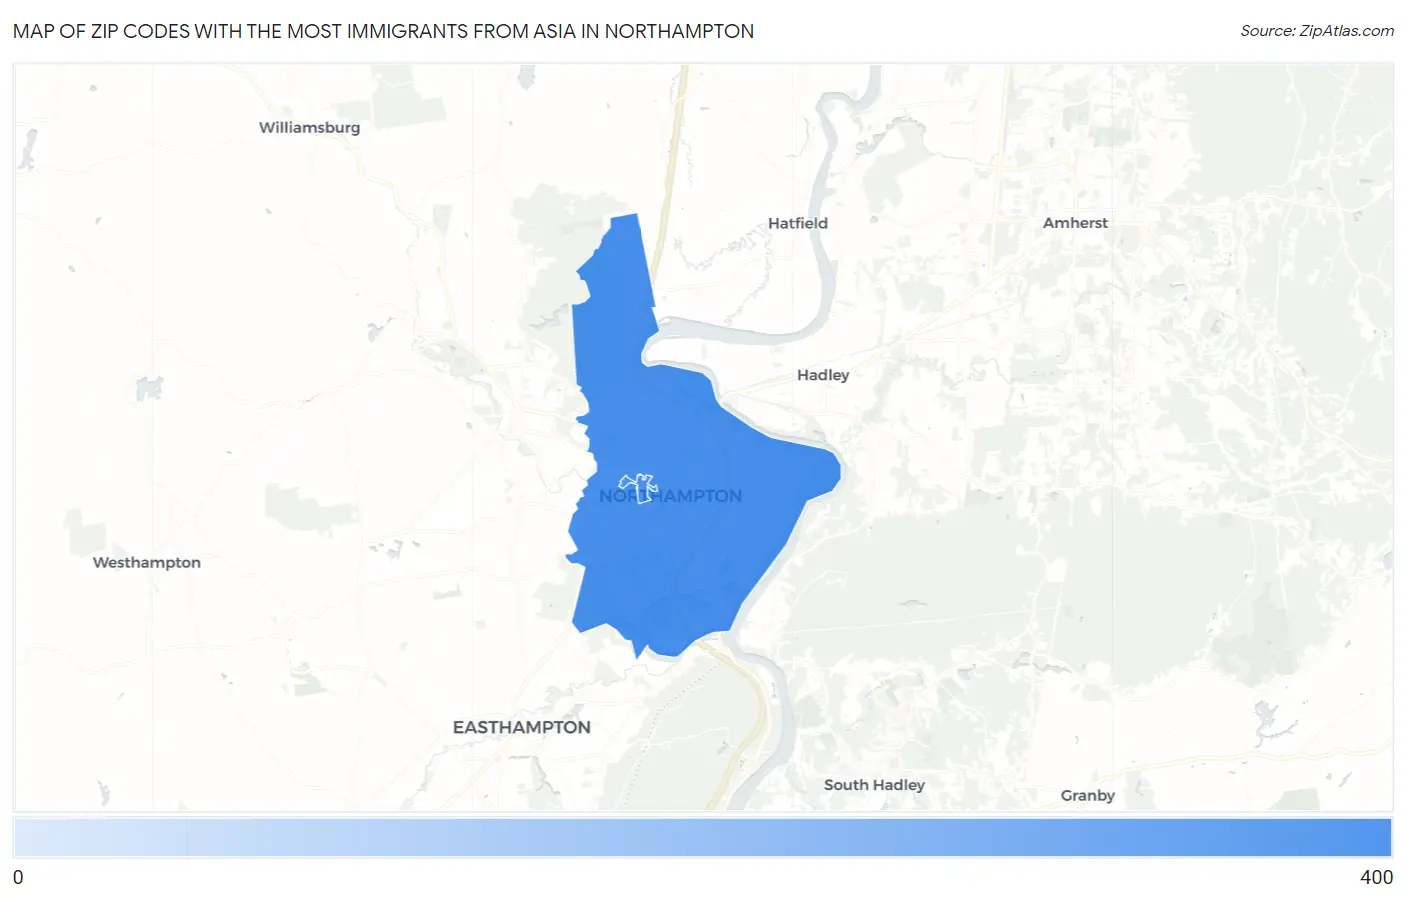
Zip Codes with the Most Immigrants from Asia in Northampton, MA
| Zip Code | Asia | vs State | vs National | |
| 1. | 01060 | 387 | 374,834(0.10%)#186 | 14,105,933(0.00%)#5,703 |
| 2. | 01063 | 328 | 374,834(0.09%)#204 | 14,105,933(0.00%)#6,159 |
1
Common Questions
What are the Top Zip Codes with the Most Immigrants from Asia in Northampton, MA?
Top Zip Codes with the Most Immigrants from Asia in Northampton, MA are:
What zip code has the Most Immigrants from Asia in Northampton, MA?
01060 has the Most Immigrants from Asia in Northampton, MA with 387.
What is the Total Immigrants from Asia in Northampton, MA?
Total Immigrants from Asia in Northampton is 804.
What is the Total Immigrants from Asia in Massachusetts?
Total Immigrants from Asia in Massachusetts is 374,834.
What is the Total Immigrants from Asia in the United States?
Total Immigrants from Asia in the United States is 14,105,933.