Zip Codes with the Lowest Percentage of Renter-Occupied Units in Northampton, MA
RELATED REPORTS & OPTIONS
Lowest Renter-Occupied
Northampton
Compare Zip Codes
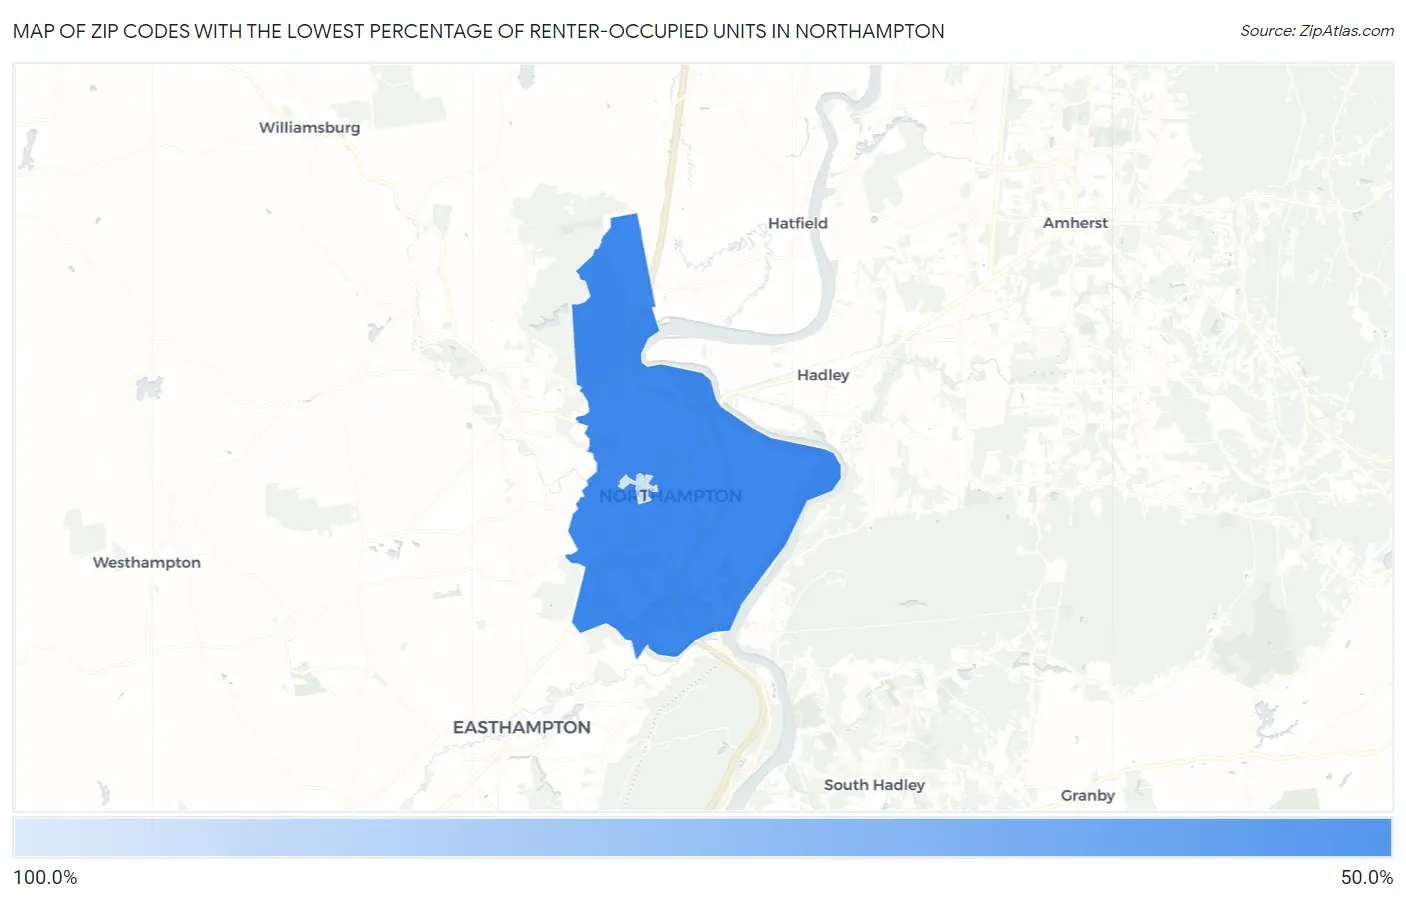
Map of Zip Codes with the Lowest Percentage of Renter-Occupied Units in Northampton
100.0%
54.3%
Zip Codes with the Lowest Percentage of Renter-Occupied Units in Northampton, MA
| Zip Code | % Renter-Occupied | vs State | vs National | |
| 1. | 01060 | 54.3% | 37.6%(+16.7)#436 | 35.2%(+19.1)#28,671 |
| 2. | 01063 | 100.0% | 37.6%(+62.4)#508 | 35.2%(+64.8)#30,868 |
1
Common Questions
What are the Top Zip Codes with the Lowest Percentage of Renter-Occupied Units in Northampton, MA?
Top Zip Codes with the Lowest Percentage of Renter-Occupied Units in Northampton, MA are:
What zip code has the Lowest Percentage of Renter-Occupied Units in Northampton, MA?
01060 has the Lowest Percentage of Renter-Occupied Units in Northampton, MA with 54.3%.
What is the Percentage of Renter-Occupied Units in Northampton, MA?
Percentage of Renter-Occupied Units in Northampton is 41.6%.
What is the Percentage of Renter-Occupied Units in Massachusetts?
Percentage of Renter-Occupied Units in Massachusetts is 37.6%.
What is the Percentage of Renter-Occupied Units in the United States?
Percentage of Renter-Occupied Units in the United States is 35.2%.