Zip Codes with the Highest Percentage of Population Employed in Security & Protection in Worcester, MA
RELATED REPORTS & OPTIONS
Security & Protection
Worcester
Compare Zip Codes
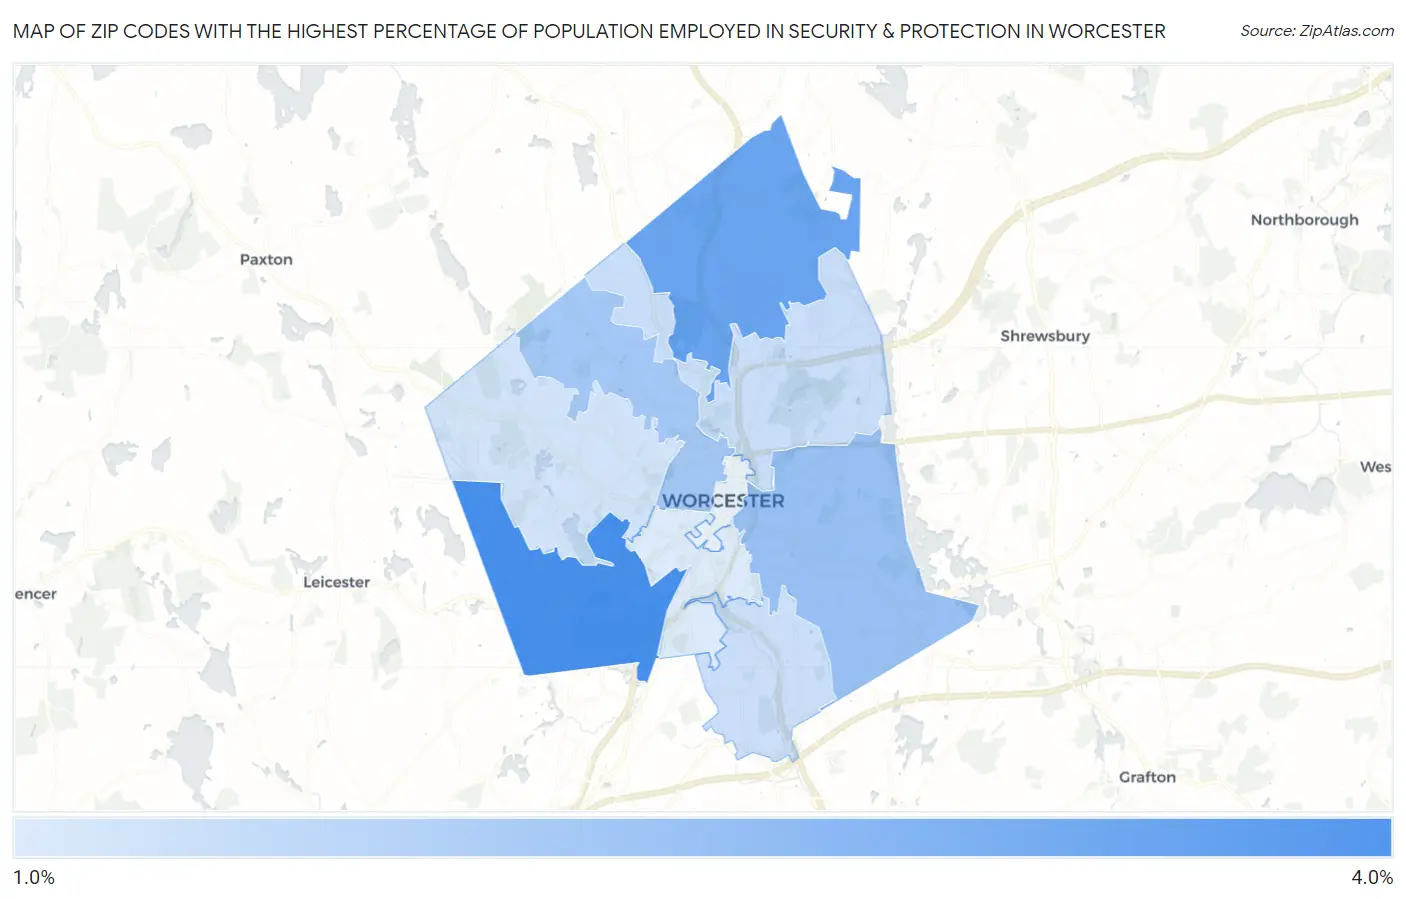
Map of Zip Codes with the Highest Percentage of Population Employed in Security & Protection in Worcester
1.3%
3.4%
Zip Codes with the Highest Percentage of Population Employed in Security & Protection in Worcester, MA
| Zip Code | % Employed | vs State | vs National | |
| 1. | 01603 | 3.4% | 2.0%(+1.34)#71 | 2.1%(+1.20)#6,083 |
| 2. | 01606 | 2.9% | 2.0%(+0.866)#107 | 2.1%(+0.731)#7,728 |
| 3. | 01604 | 2.2% | 2.0%(+0.214)#185 | 2.1%(+0.080)#11,089 |
| 4. | 01609 | 2.1% | 2.0%(+0.052)#205 | 2.1%(-0.082)#12,147 |
| 5. | 01605 | 1.6% | 2.0%(-0.439)#268 | 2.1%(-0.574)#15,608 |
| 6. | 01607 | 1.5% | 2.0%(-0.468)#271 | 2.1%(-0.602)#15,830 |
| 7. | 01602 | 1.4% | 2.0%(-0.578)#294 | 2.1%(-0.712)#16,694 |
| 8. | 01610 | 1.3% | 2.0%(-0.720)#318 | 2.1%(-0.855)#17,792 |
1
Common Questions
What are the Top 5 Zip Codes with the Highest Percentage of Population Employed in Security & Protection in Worcester, MA?
Top 5 Zip Codes with the Highest Percentage of Population Employed in Security & Protection in Worcester, MA are:
What zip code has the Highest Percentage of Population Employed in Security & Protection in Worcester, MA?
01603 has the Highest Percentage of Population Employed in Security & Protection in Worcester, MA with 3.4%.
What is the Percentage of Population Employed in Security & Protection in Worcester, MA?
Percentage of Population Employed in Security & Protection in Worcester is 2.0%.
What is the Percentage of Population Employed in Security & Protection in Massachusetts?
Percentage of Population Employed in Security & Protection in Massachusetts is 2.0%.
What is the Percentage of Population Employed in Security & Protection in the United States?
Percentage of Population Employed in Security & Protection in the United States is 2.1%.