Zip Codes with the Highest Percentage of Population Employed in Community & Social Service in Northampton, MA
RELATED REPORTS & OPTIONS
Community & Social Service
Northampton
Compare Zip Codes
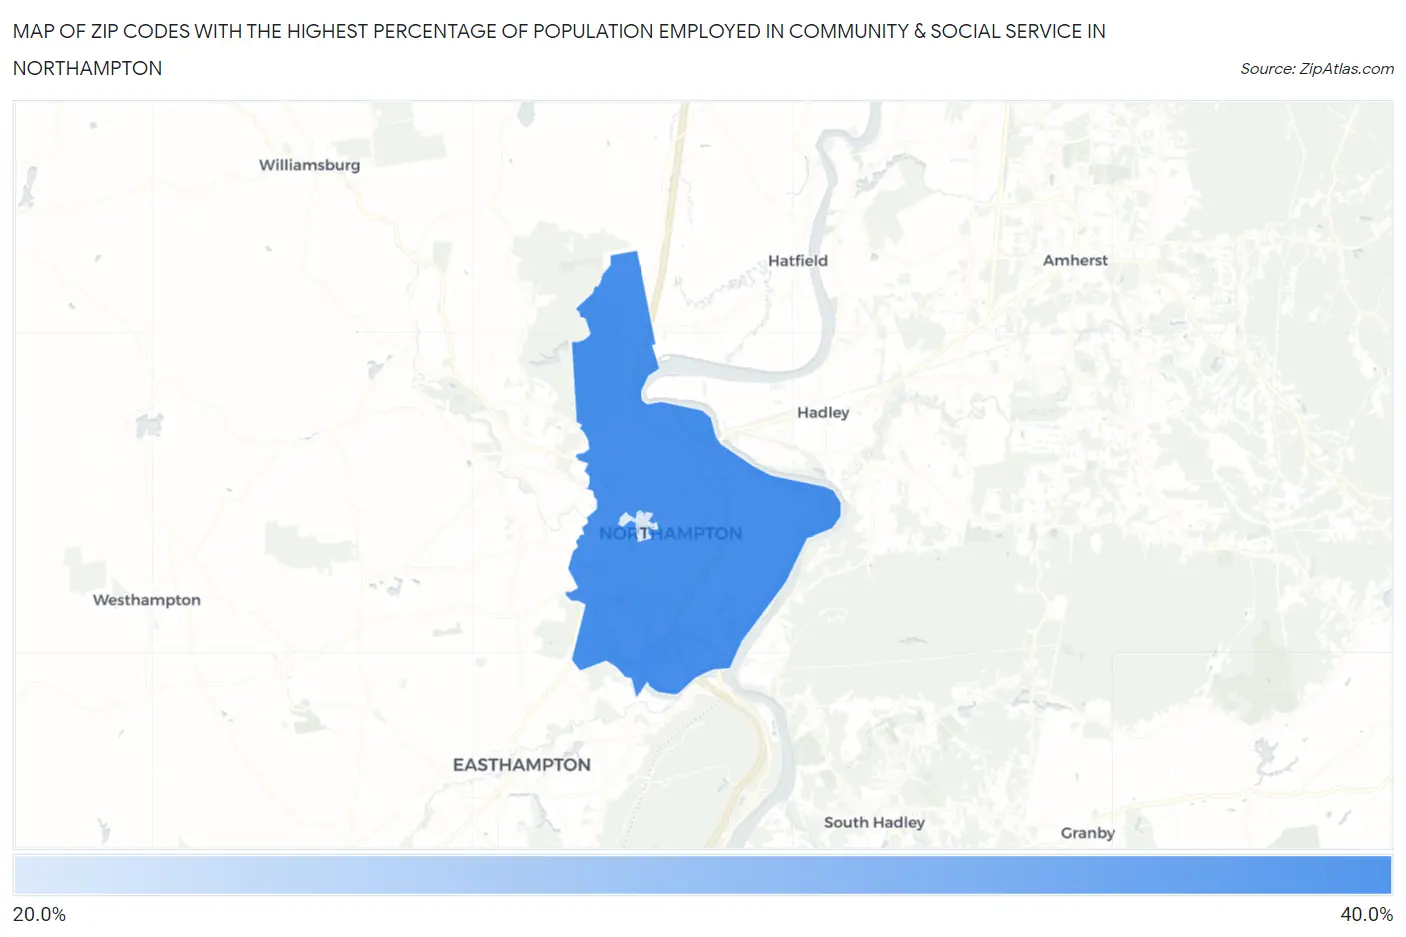
Map of Zip Codes with the Highest Percentage of Population Employed in Community & Social Service in Northampton
21.4%
31.8%
Zip Codes with the Highest Percentage of Population Employed in Community & Social Service in Northampton, MA
| Zip Code | % Employed | vs State | vs National | |
| 1. | 01060 | 31.8% | 13.5%(+18.3)#9 | 11.2%(+20.6)#500 |
| 2. | 01063 | 21.4% | 13.5%(+7.87)#50 | 11.2%(+10.2)#1,621 |
1
Common Questions
What are the Top Zip Codes with the Highest Percentage of Population Employed in Community & Social Service in Northampton, MA?
Top Zip Codes with the Highest Percentage of Population Employed in Community & Social Service in Northampton, MA are:
What zip code has the Highest Percentage of Population Employed in Community & Social Service in Northampton, MA?
01060 has the Highest Percentage of Population Employed in Community & Social Service in Northampton, MA with 31.8%.
What is the Percentage of Population Employed in Community & Social Service in Northampton, MA?
Percentage of Population Employed in Community & Social Service in Northampton is 27.1%.
What is the Percentage of Population Employed in Community & Social Service in Massachusetts?
Percentage of Population Employed in Community & Social Service in Massachusetts is 13.5%.
What is the Percentage of Population Employed in Community & Social Service in the United States?
Percentage of Population Employed in Community & Social Service in the United States is 11.2%.