Zip Codes with the Highest Percentage of Population Employed in Computer, Engineering & Science in Northampton, MA
RELATED REPORTS & OPTIONS
Computer, Engineering & Science
Northampton
Compare Zip Codes
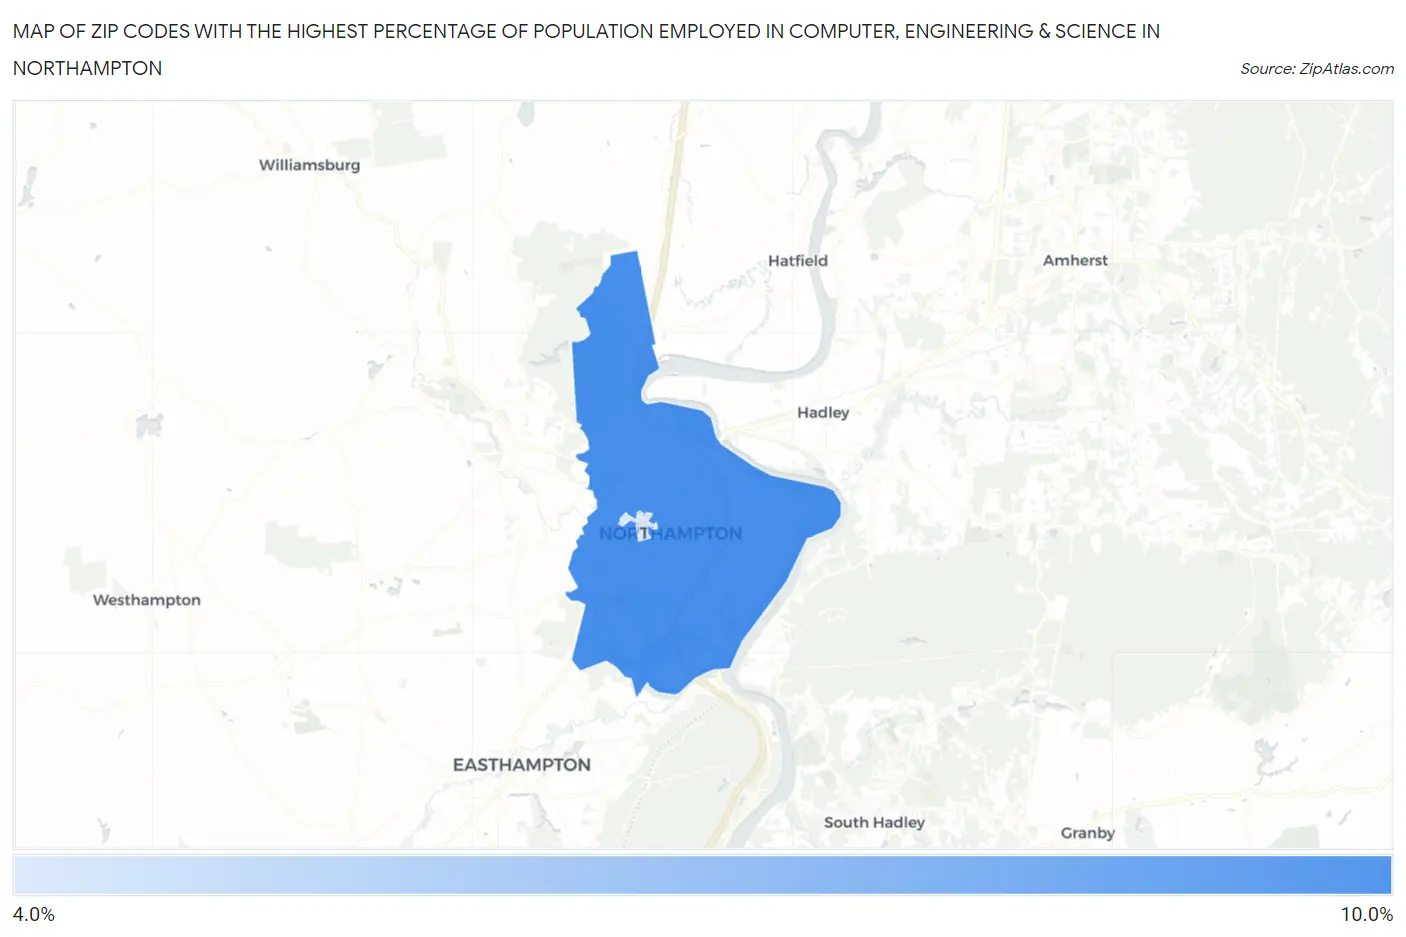
Map of Zip Codes with the Highest Percentage of Population Employed in Computer, Engineering & Science in Northampton
4.3%
8.9%
Zip Codes with the Highest Percentage of Population Employed in Computer, Engineering & Science in Northampton, MA
| Zip Code | % Employed | vs State | vs National | |
| 1. | 01060 | 8.9% | 9.8%(-0.971)#195 | 6.8%(+2.10)#4,203 |
| 2. | 01063 | 4.3% | 9.8%(-5.51)#404 | 6.8%(-2.44)#13,417 |
1
Common Questions
What are the Top Zip Codes with the Highest Percentage of Population Employed in Computer, Engineering & Science in Northampton, MA?
Top Zip Codes with the Highest Percentage of Population Employed in Computer, Engineering & Science in Northampton, MA are:
What zip code has the Highest Percentage of Population Employed in Computer, Engineering & Science in Northampton, MA?
01060 has the Highest Percentage of Population Employed in Computer, Engineering & Science in Northampton, MA with 8.9%.
What is the Percentage of Population Employed in Computer, Engineering & Science in Northampton, MA?
Percentage of Population Employed in Computer, Engineering & Science in Northampton is 8.9%.
What is the Percentage of Population Employed in Computer, Engineering & Science in Massachusetts?
Percentage of Population Employed in Computer, Engineering & Science in Massachusetts is 9.8%.
What is the Percentage of Population Employed in Computer, Engineering & Science in the United States?
Percentage of Population Employed in Computer, Engineering & Science in the United States is 6.8%.