Zip Codes with the Highest Percentage of Population Employed in Life, Physical & Social Science in Northampton, MA
RELATED REPORTS & OPTIONS
Life, Physical & Social Science
Northampton
Compare Zip Codes
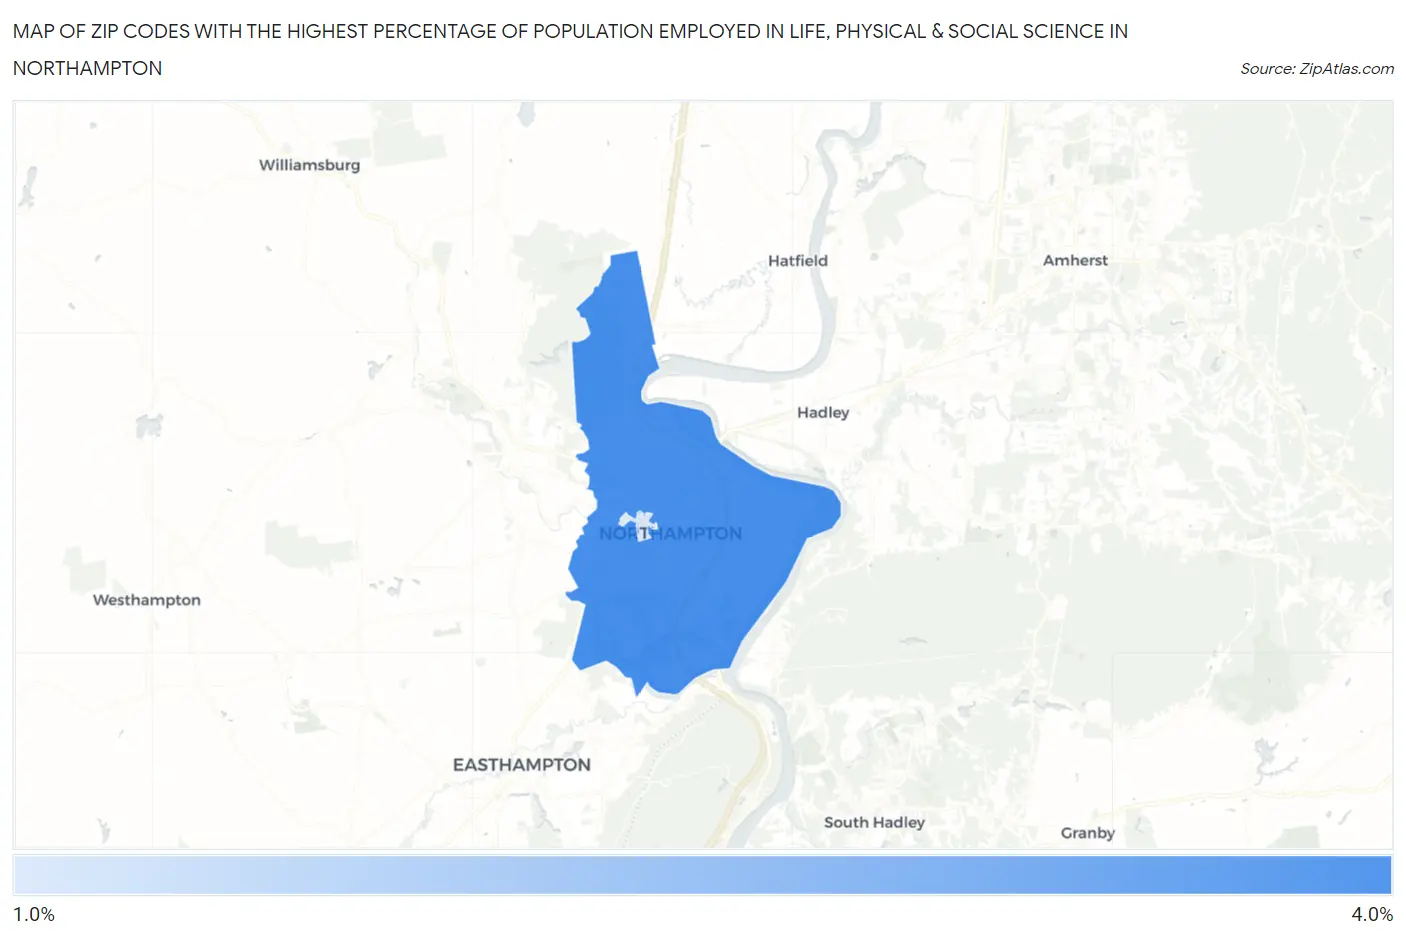
Map of Zip Codes with the Highest Percentage of Population Employed in Life, Physical & Social Science in Northampton
1.3%
3.1%
Zip Codes with the Highest Percentage of Population Employed in Life, Physical & Social Science in Northampton, MA
| Zip Code | % Employed | vs State | vs National | |
| 1. | 01060 | 3.1% | 2.4%(+0.751)#103 | 1.1%(+2.02)#1,741 |
| 2. | 01063 | 1.3% | 2.4%(-1.08)#258 | 1.1%(+0.194)#6,903 |
1
Common Questions
What are the Top Zip Codes with the Highest Percentage of Population Employed in Life, Physical & Social Science in Northampton, MA?
Top Zip Codes with the Highest Percentage of Population Employed in Life, Physical & Social Science in Northampton, MA are:
What zip code has the Highest Percentage of Population Employed in Life, Physical & Social Science in Northampton, MA?
01060 has the Highest Percentage of Population Employed in Life, Physical & Social Science in Northampton, MA with 3.1%.
What is the Percentage of Population Employed in Life, Physical & Social Science in Northampton, MA?
Percentage of Population Employed in Life, Physical & Social Science in Northampton is 2.5%.
What is the Percentage of Population Employed in Life, Physical & Social Science in Massachusetts?
Percentage of Population Employed in Life, Physical & Social Science in Massachusetts is 2.4%.
What is the Percentage of Population Employed in Life, Physical & Social Science in the United States?
Percentage of Population Employed in Life, Physical & Social Science in the United States is 1.1%.