Zip Codes with the Highest Percentage of Population Employed in Security & Protection in Fall River, MA
RELATED REPORTS & OPTIONS
Security & Protection
Fall River
Compare Zip Codes
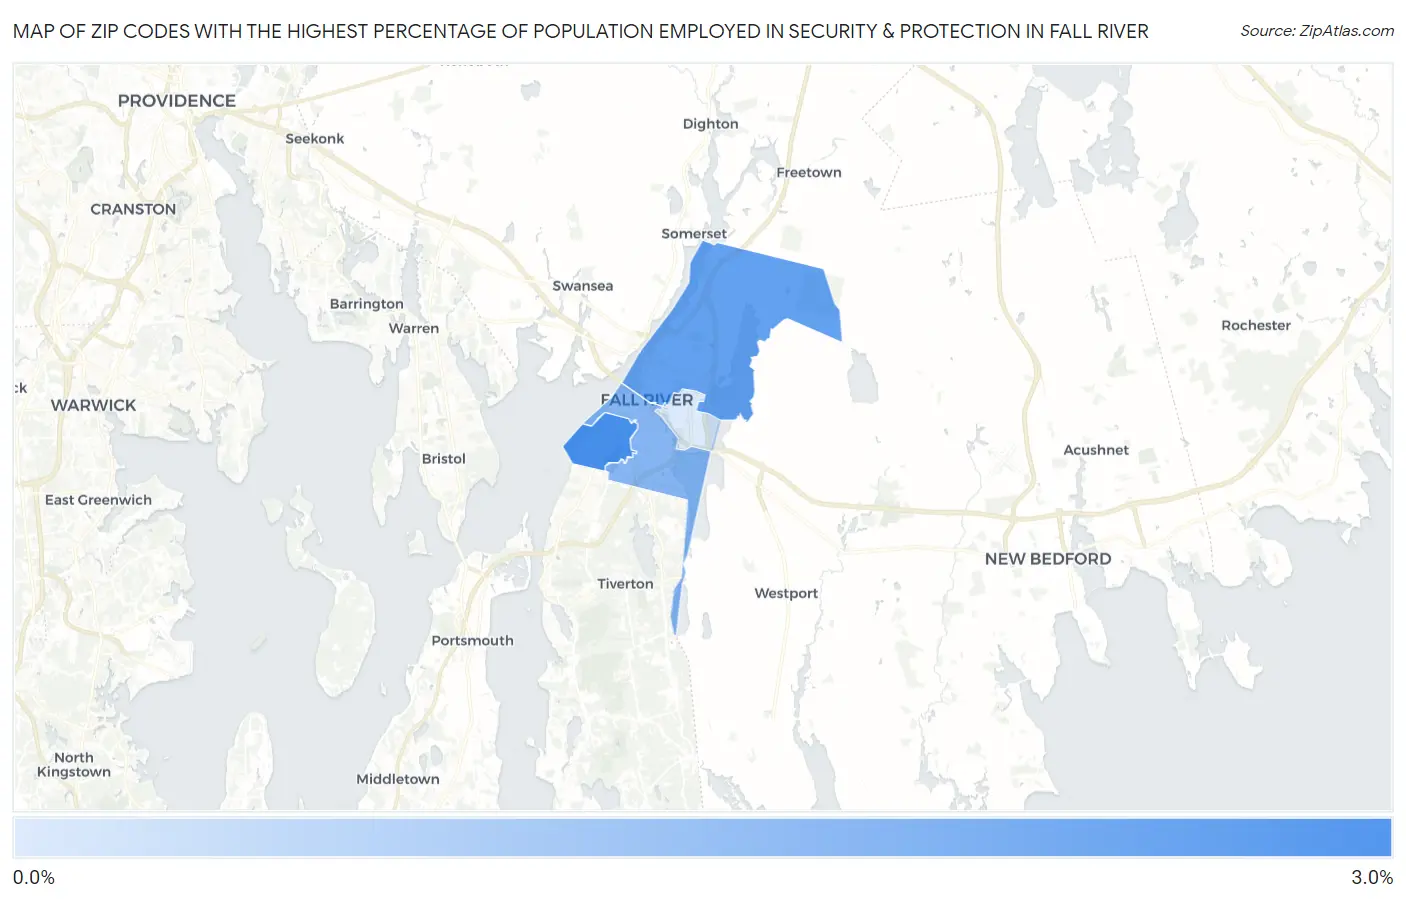
Map of Zip Codes with the Highest Percentage of Population Employed in Security & Protection in Fall River
0.82%
3.0%
Zip Codes with the Highest Percentage of Population Employed in Security & Protection in Fall River, MA
| Zip Code | % Employed | vs State | vs National | |
| 1. | 02724 | 3.0% | 2.0%(+0.939)#100 | 2.1%(+0.805)#7,416 |
| 2. | 02720 | 2.6% | 2.0%(+0.536)#137 | 2.1%(+0.402)#9,251 |
| 3. | 02721 | 2.1% | 2.0%(+0.059)#201 | 2.1%(-0.076)#12,092 |
| 4. | 02723 | 0.82% | 2.0%(-1.20)#390 | 2.1%(-1.33)#21,315 |
1
Common Questions
What are the Top 3 Zip Codes with the Highest Percentage of Population Employed in Security & Protection in Fall River, MA?
Top 3 Zip Codes with the Highest Percentage of Population Employed in Security & Protection in Fall River, MA are:
What zip code has the Highest Percentage of Population Employed in Security & Protection in Fall River, MA?
02724 has the Highest Percentage of Population Employed in Security & Protection in Fall River, MA with 3.0%.
What is the Percentage of Population Employed in Security & Protection in Fall River, MA?
Percentage of Population Employed in Security & Protection in Fall River is 2.2%.
What is the Percentage of Population Employed in Security & Protection in Massachusetts?
Percentage of Population Employed in Security & Protection in Massachusetts is 2.0%.
What is the Percentage of Population Employed in Security & Protection in the United States?
Percentage of Population Employed in Security & Protection in the United States is 2.1%.