Zip Codes with the Highest Male / Female Ratio in Northampton, MA
RELATED REPORTS & OPTIONS
Male / Female Ratio
Northampton
Compare Zip Codes
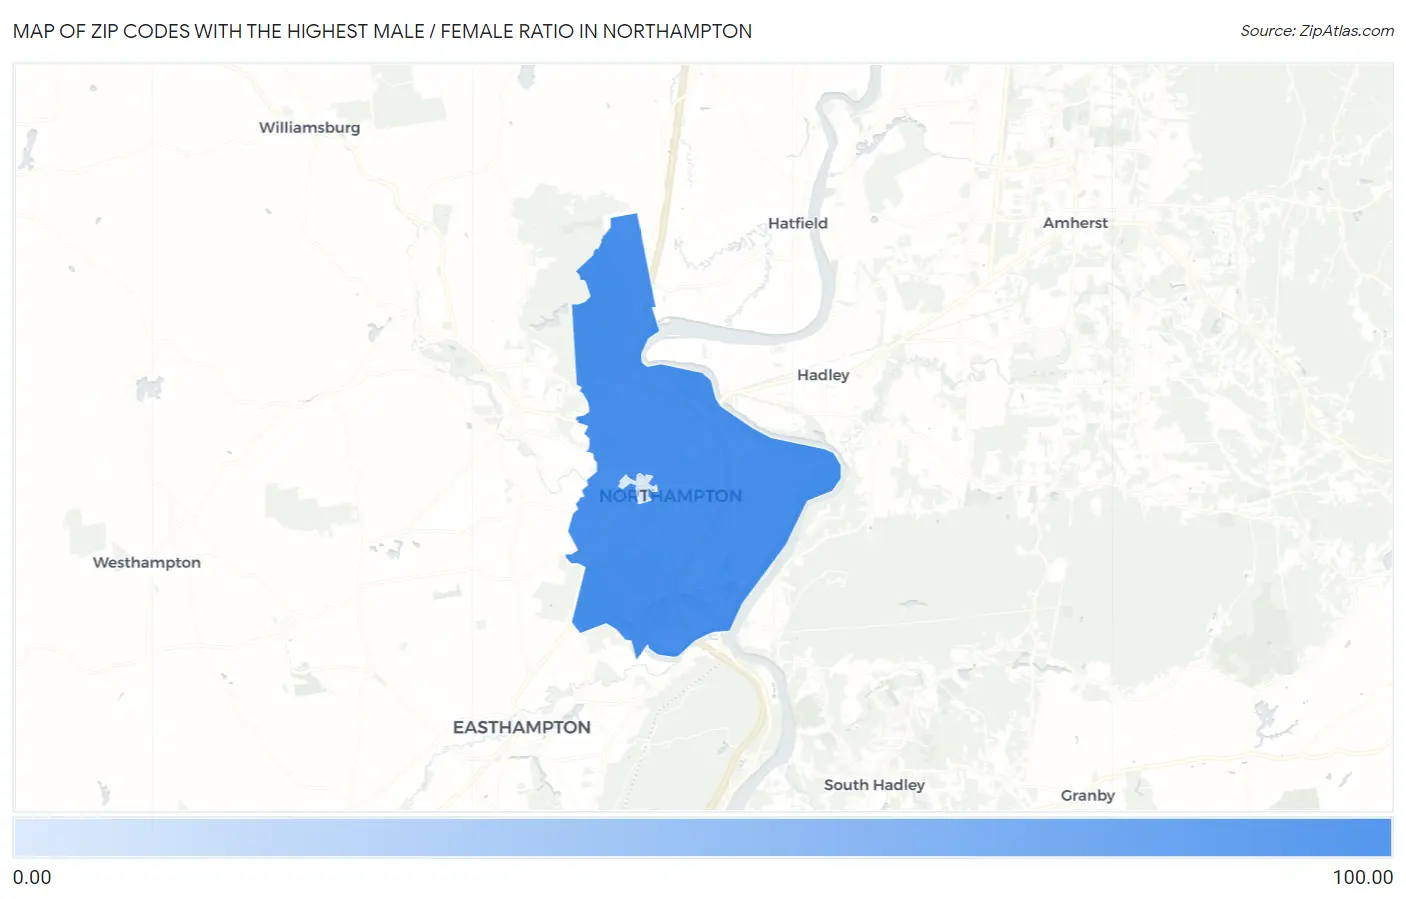
Map of Zip Codes with the Highest Male / Female Ratio in Northampton
0.67
80.42
Zip Codes with the Highest Male / Female Ratio in Northampton, MA
| Zip Code | Males / 100 Females | vs State | vs National | |
| 1. | 01060 | 80.42 | 95.92(-15.5)#492 | 98.38(-18.0)#30,163 |
| 2. | 01063 | 0.67 | 95.92(-95.2)#528 | 98.38(-97.7)#32,934 |
1
Common Questions
What are the Top Zip Codes with the Highest Male / Female Ratio in Northampton, MA?
Top Zip Codes with the Highest Male / Female Ratio in Northampton, MA are:
What zip code has the Highest Male / Female Ratio in Northampton, MA?
01060 has the Highest Male / Female Ratio in Northampton, MA with 80.42.
What is the Male to Female Ratio in Northampton, MA?
Male to Female Ratio in Northampton is 74.28.
What is the Male to Female Ratio in Massachusetts?
Male to Female Ratio in Massachusetts is 95.92.
What is the Male to Female Ratio in the United States?
Male to Female Ratio in the United States is 98.38.