Zip Codes with the Highest Percentage of Immigrants from Korea in Northampton, MA
RELATED REPORTS & OPTIONS
Korea
Northampton
Compare Zip Codes
Map of Zip Codes with the Highest Percentage of Immigrants from Korea in Northampton
0.19%
1.24%
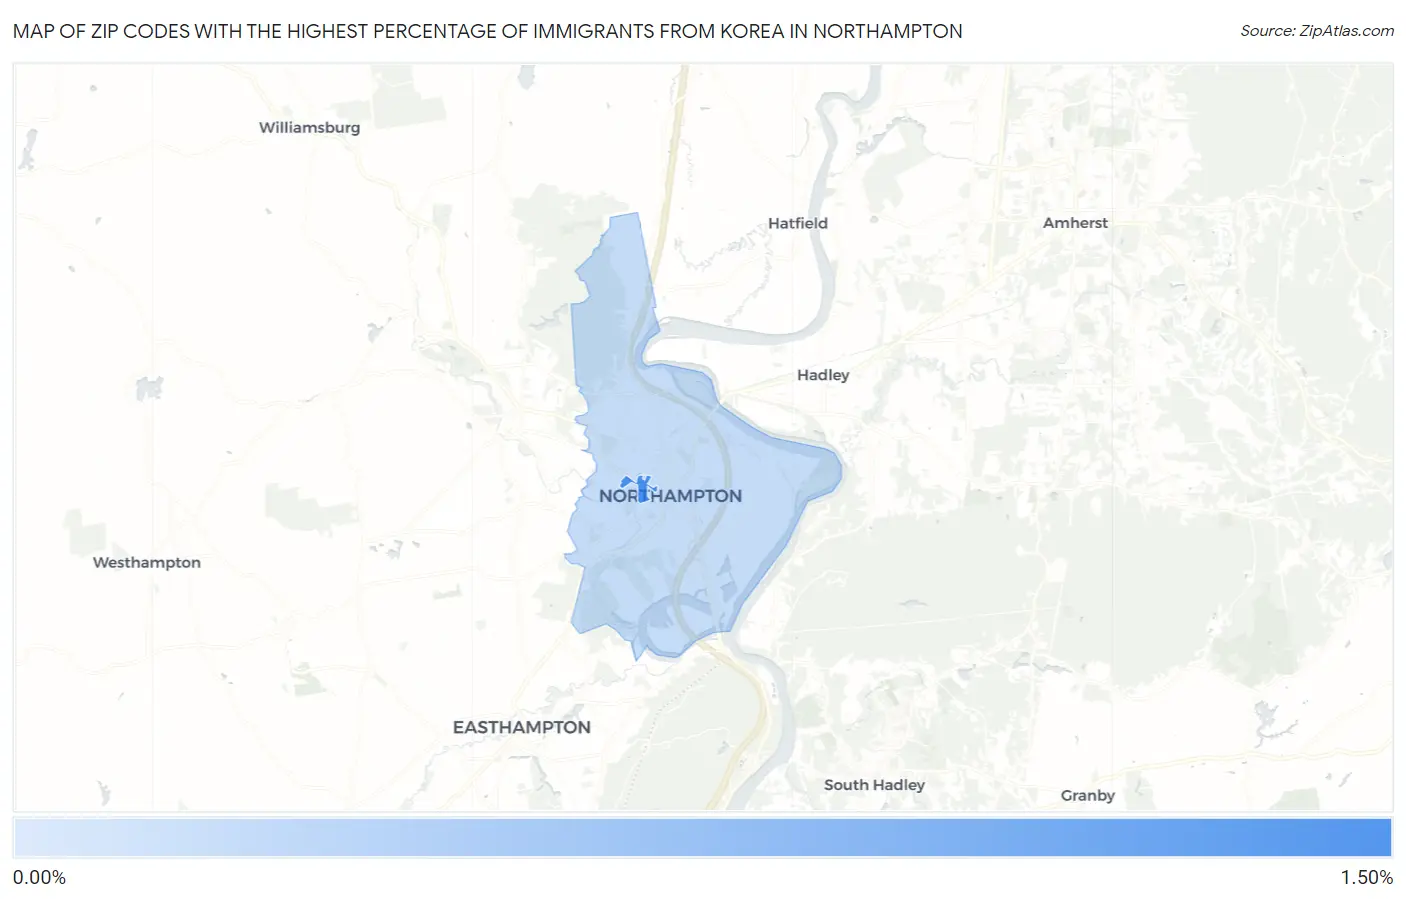
Zip Codes with the Highest Percentage of Immigrants from Korea in Northampton, MA
| Zip Code | Korea | vs State | vs National | |
| 1. | 01063 | 1.24% | 0.25%(+0.992)#18 | 0.31%(+0.932)#748 |
| 2. | 01060 | 0.19% | 0.25%(-0.062)#137 | 0.31%(-0.122)#4,875 |
1
Common Questions
What are the Top Zip Codes with the Highest Percentage of Immigrants from Korea in Northampton, MA?
Top Zip Codes with the Highest Percentage of Immigrants from Korea in Northampton, MA are:
What zip code has the Highest Percentage of Immigrants from Korea in Northampton, MA?
01063 has the Highest Percentage of Immigrants from Korea in Northampton, MA with 1.24%.
What is the Percentage of Immigrants from Korea in Northampton, MA?
Percentage of Immigrants from Korea in Northampton is 0.19%.
What is the Percentage of Immigrants from Korea in Massachusetts?
Percentage of Immigrants from Korea in Massachusetts is 0.25%.
What is the Percentage of Immigrants from Korea in the United States?
Percentage of Immigrants from Korea in the United States is 0.31%.