Senegalese vs Immigrants from Nicaragua Median Male Earnings
COMPARE
Senegalese
Immigrants from Nicaragua
Median Male Earnings
Median Male Earnings Comparison
Senegalese
Immigrants from Nicaragua
$49,774
MEDIAN MALE EARNINGS
1.0/ 100
METRIC RATING
254th/ 347
METRIC RANK
$47,482
MEDIAN MALE EARNINGS
0.1/ 100
METRIC RATING
294th/ 347
METRIC RANK
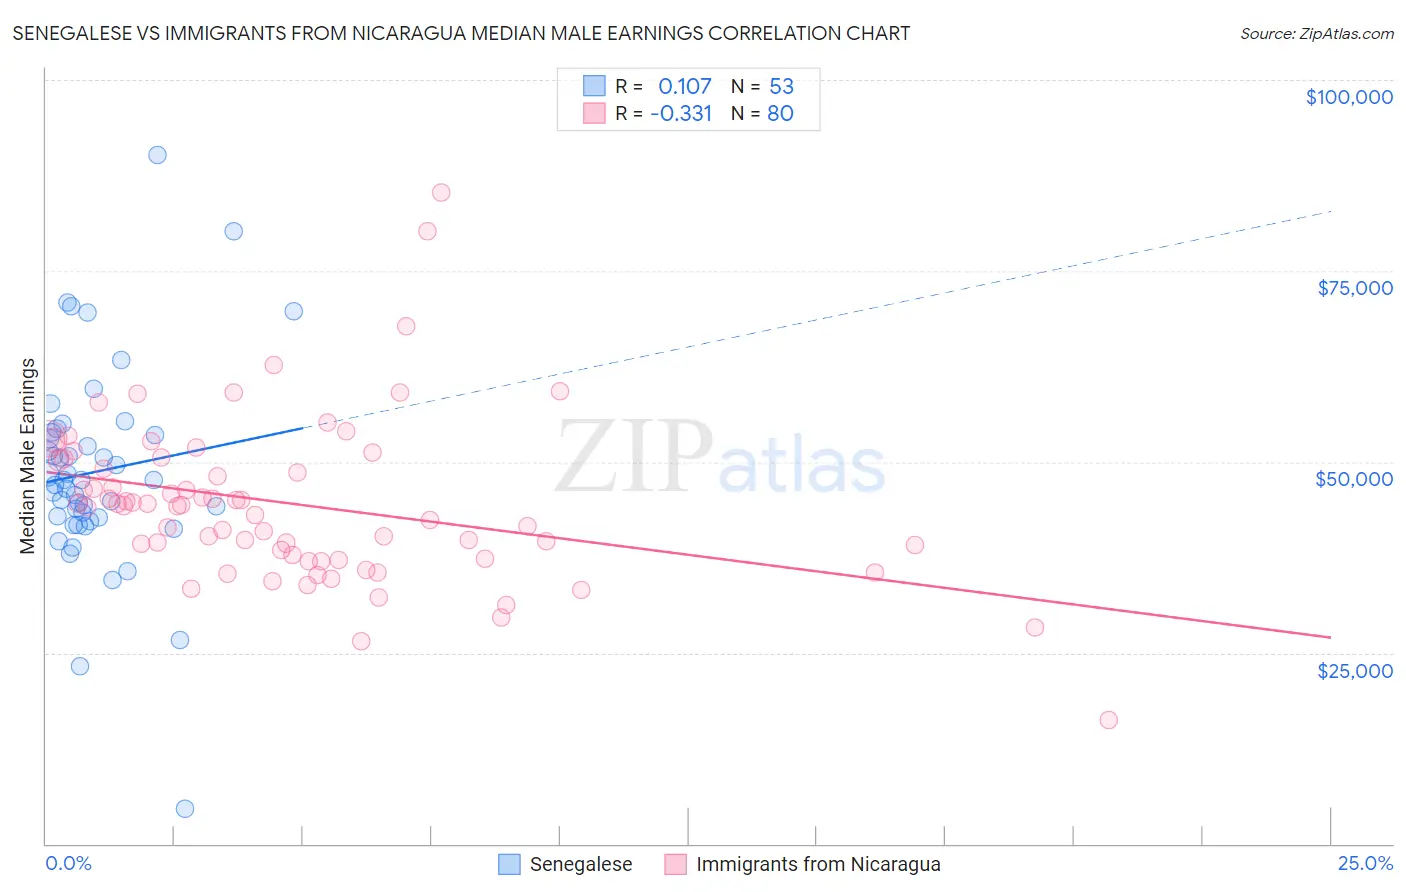
Senegalese vs Immigrants from Nicaragua Median Male Earnings Correlation Chart
The statistical analysis conducted on geographies consisting of 78,104,359 people shows a poor positive correlation between the proportion of Senegalese and median male earnings in the United States with a correlation coefficient (R) of 0.107 and weighted average of $49,774. Similarly, the statistical analysis conducted on geographies consisting of 236,305,617 people shows a mild negative correlation between the proportion of Immigrants from Nicaragua and median male earnings in the United States with a correlation coefficient (R) of -0.331 and weighted average of $47,482, a difference of 4.8%.
Median Male Earnings Correlation Summary
| Measurement | Senegalese | Immigrants from Nicaragua |
| Minimum | $4,513 | $16,250 |
| Maximum | $90,259 | $85,319 |
| Range | $85,746 | $69,069 |
| Mean | $48,737 | $44,541 |
| Median | $47,653 | $44,356 |
| Interquartile 25% (IQ1) | $42,459 | $37,535 |
| Interquartile 75% (IQ3) | $53,697 | $50,283 |
| Interquartile Range (IQR) | $11,239 | $12,748 |
| Standard Deviation (Sample) | $13,453 | $10,745 |
| Standard Deviation (Population) | $13,326 | $10,678 |
Similar Demographics by Median Male Earnings
Demographics Similar to Senegalese by Median Male Earnings
In terms of median male earnings, the demographic groups most similar to Senegalese are Alaskan Athabascan ($49,748, a difference of 0.050%), Alaska Native ($49,711, a difference of 0.13%), British West Indian ($49,636, a difference of 0.28%), German Russian ($49,924, a difference of 0.30%), and Immigrants from Cabo Verde ($50,009, a difference of 0.47%).
| Demographics | Rating | Rank | Median Male Earnings |
| Sub-Saharan Africans | 1.8 /100 | #247 | Tragic $50,408 |
| Immigrants | Guyana | 1.6 /100 | #248 | Tragic $50,321 |
| Immigrants | Burma/Myanmar | 1.6 /100 | #249 | Tragic $50,298 |
| Osage | 1.6 /100 | #250 | Tragic $50,292 |
| Immigrants | Grenada | 1.6 /100 | #251 | Tragic $50,279 |
| Immigrants | Cabo Verde | 1.2 /100 | #252 | Tragic $50,009 |
| German Russians | 1.1 /100 | #253 | Tragic $49,924 |
| Senegalese | 1.0 /100 | #254 | Tragic $49,774 |
| Alaskan Athabascans | 0.9 /100 | #255 | Tragic $49,748 |
| Alaska Natives | 0.9 /100 | #256 | Tragic $49,711 |
| British West Indians | 0.8 /100 | #257 | Tragic $49,636 |
| Cree | 0.7 /100 | #258 | Tragic $49,497 |
| Nepalese | 0.7 /100 | #259 | Tragic $49,458 |
| Iroquois | 0.7 /100 | #260 | Tragic $49,374 |
| Liberians | 0.6 /100 | #261 | Tragic $49,318 |
Demographics Similar to Immigrants from Nicaragua by Median Male Earnings
In terms of median male earnings, the demographic groups most similar to Immigrants from Nicaragua are Indonesian ($47,503, a difference of 0.040%), Central American Indian ($47,433, a difference of 0.10%), Immigrants from Dominica ($47,651, a difference of 0.36%), Inupiat ($47,281, a difference of 0.43%), and Choctaw ($47,729, a difference of 0.52%).
| Demographics | Rating | Rank | Median Male Earnings |
| Immigrants | El Salvador | 0.2 /100 | #287 | Tragic $47,973 |
| Shoshone | 0.2 /100 | #288 | Tragic $47,930 |
| Chickasaw | 0.1 /100 | #289 | Tragic $47,832 |
| Immigrants | Belize | 0.1 /100 | #290 | Tragic $47,809 |
| Choctaw | 0.1 /100 | #291 | Tragic $47,729 |
| Immigrants | Dominica | 0.1 /100 | #292 | Tragic $47,651 |
| Indonesians | 0.1 /100 | #293 | Tragic $47,503 |
| Immigrants | Nicaragua | 0.1 /100 | #294 | Tragic $47,482 |
| Central American Indians | 0.1 /100 | #295 | Tragic $47,433 |
| Inupiat | 0.1 /100 | #296 | Tragic $47,281 |
| Dominicans | 0.1 /100 | #297 | Tragic $47,204 |
| Immigrants | Micronesia | 0.1 /100 | #298 | Tragic $47,177 |
| Immigrants | Zaire | 0.1 /100 | #299 | Tragic $47,070 |
| U.S. Virgin Islanders | 0.1 /100 | #300 | Tragic $47,066 |
| Immigrants | Latin America | 0.1 /100 | #301 | Tragic $46,941 |