Seminole vs Immigrants from Nicaragua Median Male Earnings
COMPARE
Seminole
Immigrants from Nicaragua
Median Male Earnings
Median Male Earnings Comparison
Seminole
Immigrants from Nicaragua
$46,783
MEDIAN MALE EARNINGS
0.1/ 100
METRIC RATING
302nd/ 347
METRIC RANK
$47,482
MEDIAN MALE EARNINGS
0.1/ 100
METRIC RATING
294th/ 347
METRIC RANK
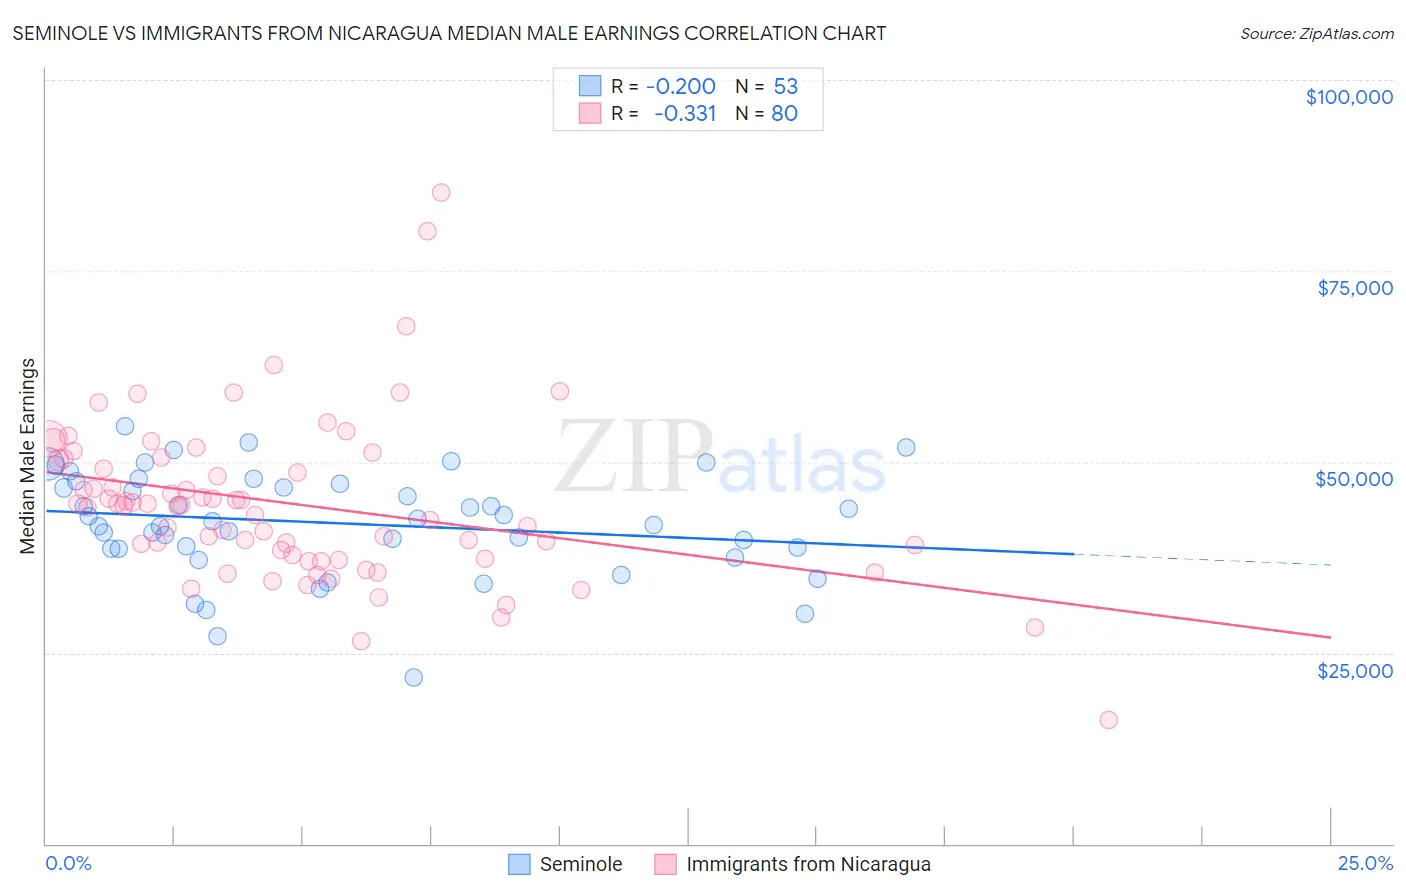
Seminole vs Immigrants from Nicaragua Median Male Earnings Correlation Chart
The statistical analysis conducted on geographies consisting of 118,283,332 people shows a poor negative correlation between the proportion of Seminole and median male earnings in the United States with a correlation coefficient (R) of -0.200 and weighted average of $46,783. Similarly, the statistical analysis conducted on geographies consisting of 236,305,617 people shows a mild negative correlation between the proportion of Immigrants from Nicaragua and median male earnings in the United States with a correlation coefficient (R) of -0.331 and weighted average of $47,482, a difference of 1.5%.
Median Male Earnings Correlation Summary
| Measurement | Seminole | Immigrants from Nicaragua |
| Minimum | $21,845 | $16,250 |
| Maximum | $54,701 | $85,319 |
| Range | $32,856 | $69,069 |
| Mean | $41,991 | $44,541 |
| Median | $42,165 | $44,356 |
| Interquartile 25% (IQ1) | $38,676 | $37,535 |
| Interquartile 75% (IQ3) | $47,251 | $50,283 |
| Interquartile Range (IQR) | $8,575 | $12,748 |
| Standard Deviation (Sample) | $6,861 | $10,745 |
| Standard Deviation (Population) | $6,796 | $10,678 |
Demographics Similar to Seminole and Immigrants from Nicaragua by Median Male Earnings
In terms of median male earnings, the demographic groups most similar to Seminole are Yaqui ($46,777, a difference of 0.010%), Bangladeshi ($46,744, a difference of 0.080%), Guatemalan ($46,736, a difference of 0.10%), Dutch West Indian ($46,656, a difference of 0.27%), and Immigrants from Dominican Republic ($46,655, a difference of 0.27%). Similarly, the demographic groups most similar to Immigrants from Nicaragua are Indonesian ($47,503, a difference of 0.040%), Central American Indian ($47,433, a difference of 0.10%), Immigrants from Dominica ($47,651, a difference of 0.36%), Inupiat ($47,281, a difference of 0.43%), and Choctaw ($47,729, a difference of 0.52%).
| Demographics | Rating | Rank | Median Male Earnings |
| Shoshone | 0.2 /100 | #288 | Tragic $47,930 |
| Chickasaw | 0.1 /100 | #289 | Tragic $47,832 |
| Immigrants | Belize | 0.1 /100 | #290 | Tragic $47,809 |
| Choctaw | 0.1 /100 | #291 | Tragic $47,729 |
| Immigrants | Dominica | 0.1 /100 | #292 | Tragic $47,651 |
| Indonesians | 0.1 /100 | #293 | Tragic $47,503 |
| Immigrants | Nicaragua | 0.1 /100 | #294 | Tragic $47,482 |
| Central American Indians | 0.1 /100 | #295 | Tragic $47,433 |
| Inupiat | 0.1 /100 | #296 | Tragic $47,281 |
| Dominicans | 0.1 /100 | #297 | Tragic $47,204 |
| Immigrants | Micronesia | 0.1 /100 | #298 | Tragic $47,177 |
| Immigrants | Zaire | 0.1 /100 | #299 | Tragic $47,070 |
| U.S. Virgin Islanders | 0.1 /100 | #300 | Tragic $47,066 |
| Immigrants | Latin America | 0.1 /100 | #301 | Tragic $46,941 |
| Seminole | 0.1 /100 | #302 | Tragic $46,783 |
| Yaqui | 0.1 /100 | #303 | Tragic $46,777 |
| Bangladeshis | 0.1 /100 | #304 | Tragic $46,744 |
| Guatemalans | 0.0 /100 | #305 | Tragic $46,736 |
| Dutch West Indians | 0.0 /100 | #306 | Tragic $46,656 |
| Immigrants | Dominican Republic | 0.0 /100 | #307 | Tragic $46,655 |
| Ottawa | 0.0 /100 | #308 | Tragic $46,611 |