Senegalese vs Yugoslavian Median Male Earnings
COMPARE
Senegalese
Yugoslavian
Median Male Earnings
Median Male Earnings Comparison
Senegalese
Yugoslavians
$49,774
MEDIAN MALE EARNINGS
1.0/ 100
METRIC RATING
254th/ 347
METRIC RANK
$53,967
MEDIAN MALE EARNINGS
37.4/ 100
METRIC RATING
182nd/ 347
METRIC RANK
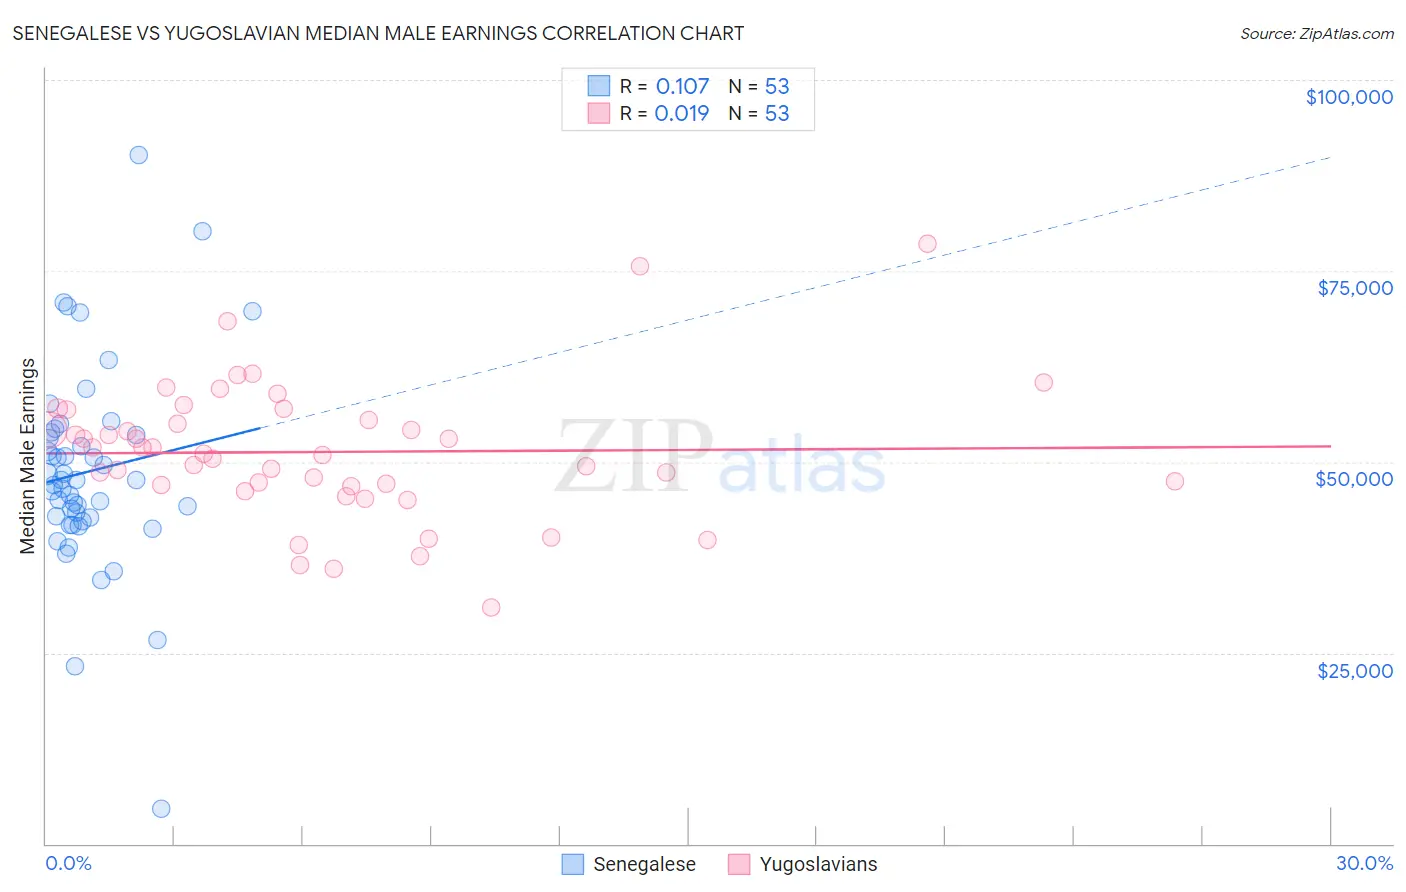
Senegalese vs Yugoslavian Median Male Earnings Correlation Chart
The statistical analysis conducted on geographies consisting of 78,104,359 people shows a poor positive correlation between the proportion of Senegalese and median male earnings in the United States with a correlation coefficient (R) of 0.107 and weighted average of $49,774. Similarly, the statistical analysis conducted on geographies consisting of 285,670,858 people shows no correlation between the proportion of Yugoslavians and median male earnings in the United States with a correlation coefficient (R) of 0.019 and weighted average of $53,967, a difference of 8.4%.
Median Male Earnings Correlation Summary
| Measurement | Senegalese | Yugoslavian |
| Minimum | $4,513 | $30,961 |
| Maximum | $90,259 | $78,594 |
| Range | $85,746 | $47,633 |
| Mean | $48,737 | $51,302 |
| Median | $47,653 | $51,102 |
| Interquartile 25% (IQ1) | $42,459 | $46,894 |
| Interquartile 75% (IQ3) | $53,697 | $56,167 |
| Interquartile Range (IQR) | $11,239 | $9,274 |
| Standard Deviation (Sample) | $13,453 | $8,961 |
| Standard Deviation (Population) | $13,326 | $8,876 |
Similar Demographics by Median Male Earnings
Demographics Similar to Senegalese by Median Male Earnings
In terms of median male earnings, the demographic groups most similar to Senegalese are Alaskan Athabascan ($49,748, a difference of 0.050%), Alaska Native ($49,711, a difference of 0.13%), British West Indian ($49,636, a difference of 0.28%), German Russian ($49,924, a difference of 0.30%), and Immigrants from Cabo Verde ($50,009, a difference of 0.47%).
| Demographics | Rating | Rank | Median Male Earnings |
| Sub-Saharan Africans | 1.8 /100 | #247 | Tragic $50,408 |
| Immigrants | Guyana | 1.6 /100 | #248 | Tragic $50,321 |
| Immigrants | Burma/Myanmar | 1.6 /100 | #249 | Tragic $50,298 |
| Osage | 1.6 /100 | #250 | Tragic $50,292 |
| Immigrants | Grenada | 1.6 /100 | #251 | Tragic $50,279 |
| Immigrants | Cabo Verde | 1.2 /100 | #252 | Tragic $50,009 |
| German Russians | 1.1 /100 | #253 | Tragic $49,924 |
| Senegalese | 1.0 /100 | #254 | Tragic $49,774 |
| Alaskan Athabascans | 0.9 /100 | #255 | Tragic $49,748 |
| Alaska Natives | 0.9 /100 | #256 | Tragic $49,711 |
| British West Indians | 0.8 /100 | #257 | Tragic $49,636 |
| Cree | 0.7 /100 | #258 | Tragic $49,497 |
| Nepalese | 0.7 /100 | #259 | Tragic $49,458 |
| Iroquois | 0.7 /100 | #260 | Tragic $49,374 |
| Liberians | 0.6 /100 | #261 | Tragic $49,318 |
Demographics Similar to Yugoslavians by Median Male Earnings
In terms of median male earnings, the demographic groups most similar to Yugoslavians are Immigrants from South America ($53,962, a difference of 0.010%), White/Caucasian ($53,925, a difference of 0.080%), Immigrants from Sierra Leone ($53,905, a difference of 0.11%), Colombian ($53,832, a difference of 0.25%), and Immigrants ($54,168, a difference of 0.37%).
| Demographics | Rating | Rank | Median Male Earnings |
| Dutch | 48.0 /100 | #175 | Average $54,410 |
| Spaniards | 47.8 /100 | #176 | Average $54,401 |
| Costa Ricans | 44.8 /100 | #177 | Average $54,279 |
| Sierra Leoneans | 44.8 /100 | #178 | Average $54,279 |
| Celtics | 43.9 /100 | #179 | Average $54,242 |
| Iraqis | 42.5 /100 | #180 | Average $54,182 |
| Immigrants | Immigrants | 42.1 /100 | #181 | Average $54,168 |
| Yugoslavians | 37.4 /100 | #182 | Fair $53,967 |
| Immigrants | South America | 37.3 /100 | #183 | Fair $53,962 |
| Whites/Caucasians | 36.5 /100 | #184 | Fair $53,925 |
| Immigrants | Sierra Leone | 36.0 /100 | #185 | Fair $53,905 |
| Colombians | 34.4 /100 | #186 | Fair $53,832 |
| Immigrants | Eritrea | 31.8 /100 | #187 | Fair $53,715 |
| Immigrants | Eastern Africa | 31.8 /100 | #188 | Fair $53,713 |
| Puget Sound Salish | 31.6 /100 | #189 | Fair $53,704 |