Senegalese vs Maltese Median Male Earnings
COMPARE
Senegalese
Maltese
Median Male Earnings
Median Male Earnings Comparison
Senegalese
Maltese
$49,774
MEDIAN MALE EARNINGS
1.0/ 100
METRIC RATING
254th/ 347
METRIC RANK
$62,953
MEDIAN MALE EARNINGS
100.0/ 100
METRIC RATING
38th/ 347
METRIC RANK
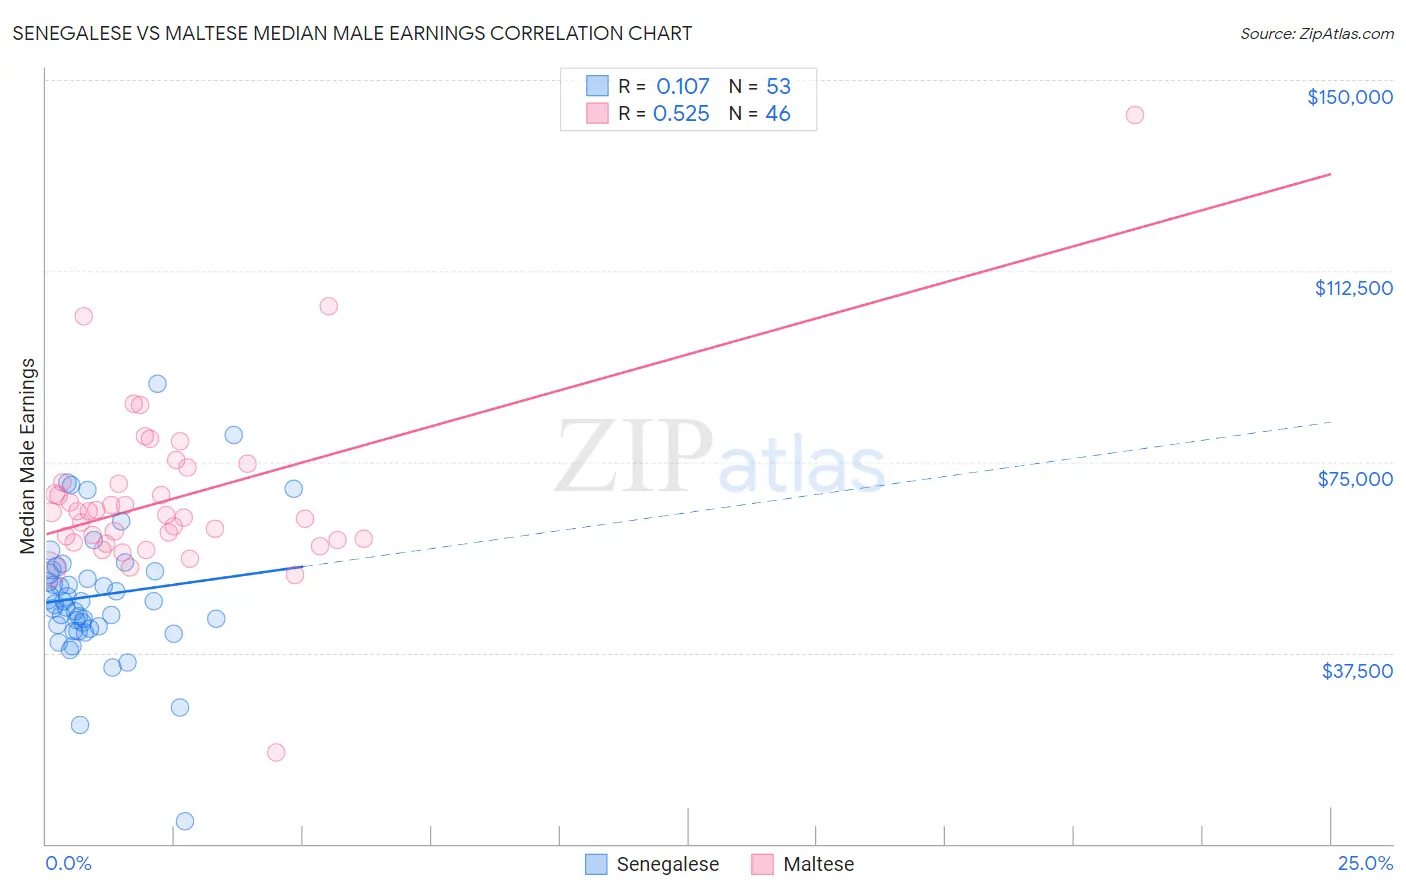
Senegalese vs Maltese Median Male Earnings Correlation Chart
The statistical analysis conducted on geographies consisting of 78,104,359 people shows a poor positive correlation between the proportion of Senegalese and median male earnings in the United States with a correlation coefficient (R) of 0.107 and weighted average of $49,774. Similarly, the statistical analysis conducted on geographies consisting of 126,470,445 people shows a substantial positive correlation between the proportion of Maltese and median male earnings in the United States with a correlation coefficient (R) of 0.525 and weighted average of $62,953, a difference of 26.5%.
Median Male Earnings Correlation Summary
| Measurement | Senegalese | Maltese |
| Minimum | $4,513 | $17,917 |
| Maximum | $90,259 | $143,125 |
| Range | $85,746 | $125,208 |
| Mean | $48,737 | $67,890 |
| Median | $47,653 | $64,879 |
| Interquartile 25% (IQ1) | $42,459 | $59,600 |
| Interquartile 75% (IQ3) | $53,697 | $71,008 |
| Interquartile Range (IQR) | $11,239 | $11,408 |
| Standard Deviation (Sample) | $13,453 | $17,590 |
| Standard Deviation (Population) | $13,326 | $17,397 |
Similar Demographics by Median Male Earnings
Demographics Similar to Senegalese by Median Male Earnings
In terms of median male earnings, the demographic groups most similar to Senegalese are Alaskan Athabascan ($49,748, a difference of 0.050%), Alaska Native ($49,711, a difference of 0.13%), British West Indian ($49,636, a difference of 0.28%), German Russian ($49,924, a difference of 0.30%), and Immigrants from Cabo Verde ($50,009, a difference of 0.47%).
| Demographics | Rating | Rank | Median Male Earnings |
| Sub-Saharan Africans | 1.8 /100 | #247 | Tragic $50,408 |
| Immigrants | Guyana | 1.6 /100 | #248 | Tragic $50,321 |
| Immigrants | Burma/Myanmar | 1.6 /100 | #249 | Tragic $50,298 |
| Osage | 1.6 /100 | #250 | Tragic $50,292 |
| Immigrants | Grenada | 1.6 /100 | #251 | Tragic $50,279 |
| Immigrants | Cabo Verde | 1.2 /100 | #252 | Tragic $50,009 |
| German Russians | 1.1 /100 | #253 | Tragic $49,924 |
| Senegalese | 1.0 /100 | #254 | Tragic $49,774 |
| Alaskan Athabascans | 0.9 /100 | #255 | Tragic $49,748 |
| Alaska Natives | 0.9 /100 | #256 | Tragic $49,711 |
| British West Indians | 0.8 /100 | #257 | Tragic $49,636 |
| Cree | 0.7 /100 | #258 | Tragic $49,497 |
| Nepalese | 0.7 /100 | #259 | Tragic $49,458 |
| Iroquois | 0.7 /100 | #260 | Tragic $49,374 |
| Liberians | 0.6 /100 | #261 | Tragic $49,318 |
Demographics Similar to Maltese by Median Male Earnings
In terms of median male earnings, the demographic groups most similar to Maltese are Immigrants from South Africa ($62,899, a difference of 0.090%), Australian ($62,857, a difference of 0.15%), Immigrants from Sri Lanka ($63,099, a difference of 0.23%), Immigrants from Turkey ($62,728, a difference of 0.36%), and Immigrants from Greece ($62,689, a difference of 0.42%).
| Demographics | Rating | Rank | Median Male Earnings |
| Latvians | 100.0 /100 | #31 | Exceptional $63,498 |
| Soviet Union | 100.0 /100 | #32 | Exceptional $63,382 |
| Immigrants | Lithuania | 100.0 /100 | #33 | Exceptional $63,346 |
| Immigrants | Russia | 100.0 /100 | #34 | Exceptional $63,326 |
| Immigrants | Asia | 100.0 /100 | #35 | Exceptional $63,240 |
| Israelis | 100.0 /100 | #36 | Exceptional $63,228 |
| Immigrants | Sri Lanka | 100.0 /100 | #37 | Exceptional $63,099 |
| Maltese | 100.0 /100 | #38 | Exceptional $62,953 |
| Immigrants | South Africa | 100.0 /100 | #39 | Exceptional $62,899 |
| Australians | 100.0 /100 | #40 | Exceptional $62,857 |
| Immigrants | Turkey | 100.0 /100 | #41 | Exceptional $62,728 |
| Immigrants | Greece | 100.0 /100 | #42 | Exceptional $62,689 |
| Immigrants | Belarus | 100.0 /100 | #43 | Exceptional $62,658 |
| Cambodians | 100.0 /100 | #44 | Exceptional $62,516 |
| Bulgarians | 100.0 /100 | #45 | Exceptional $62,378 |