Senegalese vs Sudanese Median Male Earnings
COMPARE
Senegalese
Sudanese
Median Male Earnings
Median Male Earnings Comparison
Senegalese
Sudanese
$49,774
MEDIAN MALE EARNINGS
1.0/ 100
METRIC RATING
254th/ 347
METRIC RANK
$51,216
MEDIAN MALE EARNINGS
3.9/ 100
METRIC RATING
232nd/ 347
METRIC RANK
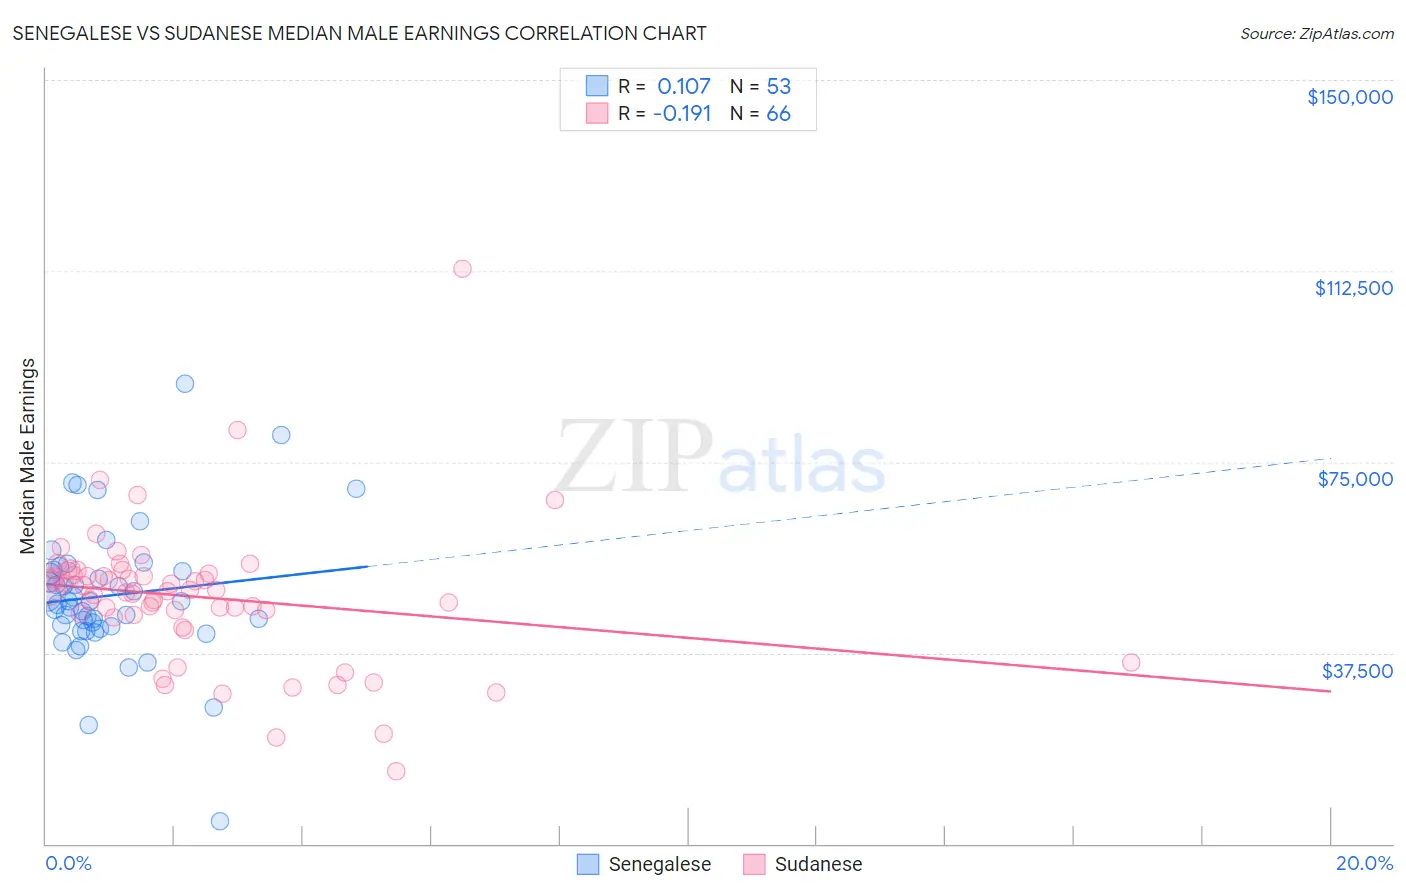
Senegalese vs Sudanese Median Male Earnings Correlation Chart
The statistical analysis conducted on geographies consisting of 78,104,359 people shows a poor positive correlation between the proportion of Senegalese and median male earnings in the United States with a correlation coefficient (R) of 0.107 and weighted average of $49,774. Similarly, the statistical analysis conducted on geographies consisting of 110,150,959 people shows a poor negative correlation between the proportion of Sudanese and median male earnings in the United States with a correlation coefficient (R) of -0.191 and weighted average of $51,216, a difference of 2.9%.
Median Male Earnings Correlation Summary
| Measurement | Senegalese | Sudanese |
| Minimum | $4,513 | $14,310 |
| Maximum | $90,259 | $113,008 |
| Range | $85,746 | $98,698 |
| Mean | $48,737 | $48,489 |
| Median | $47,653 | $49,650 |
| Interquartile 25% (IQ1) | $42,459 | $44,972 |
| Interquartile 75% (IQ3) | $53,697 | $53,130 |
| Interquartile Range (IQR) | $11,239 | $8,158 |
| Standard Deviation (Sample) | $13,453 | $14,082 |
| Standard Deviation (Population) | $13,326 | $13,975 |
Similar Demographics by Median Male Earnings
Demographics Similar to Senegalese by Median Male Earnings
In terms of median male earnings, the demographic groups most similar to Senegalese are Alaskan Athabascan ($49,748, a difference of 0.050%), Alaska Native ($49,711, a difference of 0.13%), British West Indian ($49,636, a difference of 0.28%), German Russian ($49,924, a difference of 0.30%), and Immigrants from Cabo Verde ($50,009, a difference of 0.47%).
| Demographics | Rating | Rank | Median Male Earnings |
| Sub-Saharan Africans | 1.8 /100 | #247 | Tragic $50,408 |
| Immigrants | Guyana | 1.6 /100 | #248 | Tragic $50,321 |
| Immigrants | Burma/Myanmar | 1.6 /100 | #249 | Tragic $50,298 |
| Osage | 1.6 /100 | #250 | Tragic $50,292 |
| Immigrants | Grenada | 1.6 /100 | #251 | Tragic $50,279 |
| Immigrants | Cabo Verde | 1.2 /100 | #252 | Tragic $50,009 |
| German Russians | 1.1 /100 | #253 | Tragic $49,924 |
| Senegalese | 1.0 /100 | #254 | Tragic $49,774 |
| Alaskan Athabascans | 0.9 /100 | #255 | Tragic $49,748 |
| Alaska Natives | 0.9 /100 | #256 | Tragic $49,711 |
| British West Indians | 0.8 /100 | #257 | Tragic $49,636 |
| Cree | 0.7 /100 | #258 | Tragic $49,497 |
| Nepalese | 0.7 /100 | #259 | Tragic $49,458 |
| Iroquois | 0.7 /100 | #260 | Tragic $49,374 |
| Liberians | 0.6 /100 | #261 | Tragic $49,318 |
Demographics Similar to Sudanese by Median Male Earnings
In terms of median male earnings, the demographic groups most similar to Sudanese are Barbadian ($51,236, a difference of 0.040%), Aleut ($51,168, a difference of 0.090%), Immigrants from Nigeria ($51,310, a difference of 0.18%), Cape Verdean ($51,103, a difference of 0.22%), and Immigrants from Trinidad and Tobago ($51,376, a difference of 0.31%).
| Demographics | Rating | Rank | Median Male Earnings |
| Immigrants | Sudan | 5.0 /100 | #225 | Tragic $51,489 |
| Japanese | 4.9 /100 | #226 | Tragic $51,473 |
| Trinidadians and Tobagonians | 4.8 /100 | #227 | Tragic $51,446 |
| Samoans | 4.6 /100 | #228 | Tragic $51,389 |
| Immigrants | Trinidad and Tobago | 4.5 /100 | #229 | Tragic $51,376 |
| Immigrants | Nigeria | 4.2 /100 | #230 | Tragic $51,310 |
| Barbadians | 3.9 /100 | #231 | Tragic $51,236 |
| Sudanese | 3.9 /100 | #232 | Tragic $51,216 |
| Aleuts | 3.7 /100 | #233 | Tragic $51,168 |
| Cape Verdeans | 3.5 /100 | #234 | Tragic $51,103 |
| Immigrants | Western Africa | 3.0 /100 | #235 | Tragic $50,940 |
| Pennsylvania Germans | 2.8 /100 | #236 | Tragic $50,878 |
| Immigrants | Barbados | 2.6 /100 | #237 | Tragic $50,795 |
| Malaysians | 2.5 /100 | #238 | Tragic $50,772 |
| Americans | 2.5 /100 | #239 | Tragic $50,761 |