Israeli vs Immigrants from Nicaragua Median Male Earnings
COMPARE
Israeli
Immigrants from Nicaragua
Median Male Earnings
Median Male Earnings Comparison
Israelis
Immigrants from Nicaragua
$63,228
MEDIAN MALE EARNINGS
100.0/ 100
METRIC RATING
36th/ 347
METRIC RANK
$47,482
MEDIAN MALE EARNINGS
0.1/ 100
METRIC RATING
294th/ 347
METRIC RANK
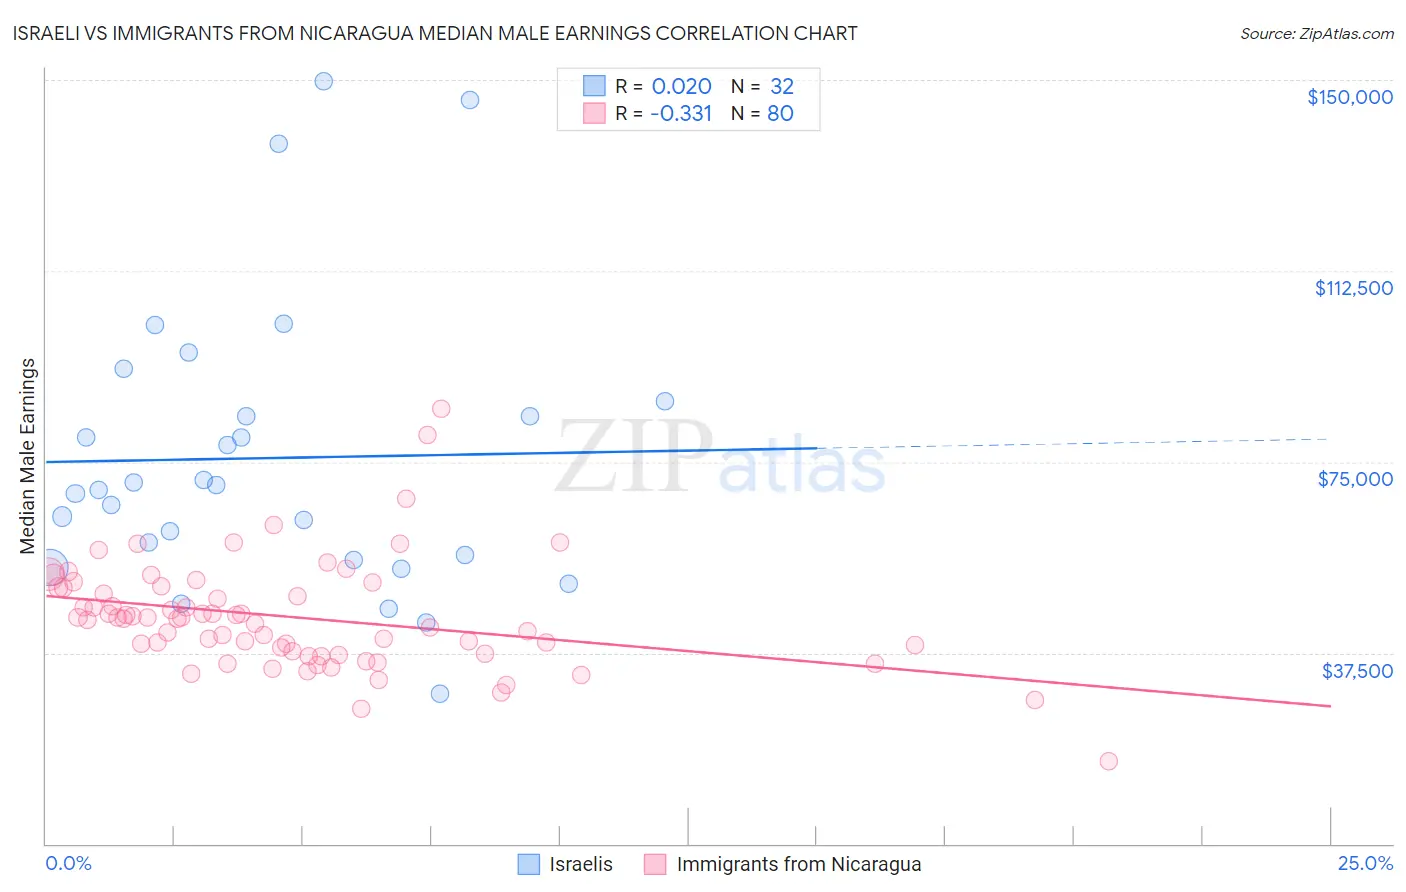
Israeli vs Immigrants from Nicaragua Median Male Earnings Correlation Chart
The statistical analysis conducted on geographies consisting of 211,181,462 people shows no correlation between the proportion of Israelis and median male earnings in the United States with a correlation coefficient (R) of 0.020 and weighted average of $63,228. Similarly, the statistical analysis conducted on geographies consisting of 236,305,617 people shows a mild negative correlation between the proportion of Immigrants from Nicaragua and median male earnings in the United States with a correlation coefficient (R) of -0.331 and weighted average of $47,482, a difference of 33.2%.
Median Male Earnings Correlation Summary
| Measurement | Israeli | Immigrants from Nicaragua |
| Minimum | $29,375 | $16,250 |
| Maximum | $149,778 | $85,319 |
| Range | $120,403 | $69,069 |
| Mean | $75,746 | $44,541 |
| Median | $69,912 | $44,356 |
| Interquartile 25% (IQ1) | $56,213 | $37,535 |
| Interquartile 75% (IQ3) | $85,475 | $50,283 |
| Interquartile Range (IQR) | $29,262 | $12,748 |
| Standard Deviation (Sample) | $28,326 | $10,745 |
| Standard Deviation (Population) | $27,880 | $10,678 |
Similar Demographics by Median Male Earnings
Demographics Similar to Israelis by Median Male Earnings
In terms of median male earnings, the demographic groups most similar to Israelis are Immigrants from Asia ($63,240, a difference of 0.020%), Immigrants from Russia ($63,326, a difference of 0.16%), Immigrants from Lithuania ($63,346, a difference of 0.19%), Immigrants from Sri Lanka ($63,099, a difference of 0.20%), and Soviet Union ($63,382, a difference of 0.24%).
| Demographics | Rating | Rank | Median Male Earnings |
| Asians | 100.0 /100 | #29 | Exceptional $63,827 |
| Immigrants | France | 100.0 /100 | #30 | Exceptional $63,715 |
| Latvians | 100.0 /100 | #31 | Exceptional $63,498 |
| Soviet Union | 100.0 /100 | #32 | Exceptional $63,382 |
| Immigrants | Lithuania | 100.0 /100 | #33 | Exceptional $63,346 |
| Immigrants | Russia | 100.0 /100 | #34 | Exceptional $63,326 |
| Immigrants | Asia | 100.0 /100 | #35 | Exceptional $63,240 |
| Israelis | 100.0 /100 | #36 | Exceptional $63,228 |
| Immigrants | Sri Lanka | 100.0 /100 | #37 | Exceptional $63,099 |
| Maltese | 100.0 /100 | #38 | Exceptional $62,953 |
| Immigrants | South Africa | 100.0 /100 | #39 | Exceptional $62,899 |
| Australians | 100.0 /100 | #40 | Exceptional $62,857 |
| Immigrants | Turkey | 100.0 /100 | #41 | Exceptional $62,728 |
| Immigrants | Greece | 100.0 /100 | #42 | Exceptional $62,689 |
| Immigrants | Belarus | 100.0 /100 | #43 | Exceptional $62,658 |
Demographics Similar to Immigrants from Nicaragua by Median Male Earnings
In terms of median male earnings, the demographic groups most similar to Immigrants from Nicaragua are Indonesian ($47,503, a difference of 0.040%), Central American Indian ($47,433, a difference of 0.10%), Immigrants from Dominica ($47,651, a difference of 0.36%), Inupiat ($47,281, a difference of 0.43%), and Choctaw ($47,729, a difference of 0.52%).
| Demographics | Rating | Rank | Median Male Earnings |
| Immigrants | El Salvador | 0.2 /100 | #287 | Tragic $47,973 |
| Shoshone | 0.2 /100 | #288 | Tragic $47,930 |
| Chickasaw | 0.1 /100 | #289 | Tragic $47,832 |
| Immigrants | Belize | 0.1 /100 | #290 | Tragic $47,809 |
| Choctaw | 0.1 /100 | #291 | Tragic $47,729 |
| Immigrants | Dominica | 0.1 /100 | #292 | Tragic $47,651 |
| Indonesians | 0.1 /100 | #293 | Tragic $47,503 |
| Immigrants | Nicaragua | 0.1 /100 | #294 | Tragic $47,482 |
| Central American Indians | 0.1 /100 | #295 | Tragic $47,433 |
| Inupiat | 0.1 /100 | #296 | Tragic $47,281 |
| Dominicans | 0.1 /100 | #297 | Tragic $47,204 |
| Immigrants | Micronesia | 0.1 /100 | #298 | Tragic $47,177 |
| Immigrants | Zaire | 0.1 /100 | #299 | Tragic $47,070 |
| U.S. Virgin Islanders | 0.1 /100 | #300 | Tragic $47,066 |
| Immigrants | Latin America | 0.1 /100 | #301 | Tragic $46,941 |