Indonesian vs Immigrants from Nicaragua Median Male Earnings
COMPARE
Indonesian
Immigrants from Nicaragua
Median Male Earnings
Median Male Earnings Comparison
Indonesians
Immigrants from Nicaragua
$47,503
MEDIAN MALE EARNINGS
0.1/ 100
METRIC RATING
293rd/ 347
METRIC RANK
$47,482
MEDIAN MALE EARNINGS
0.1/ 100
METRIC RATING
294th/ 347
METRIC RANK
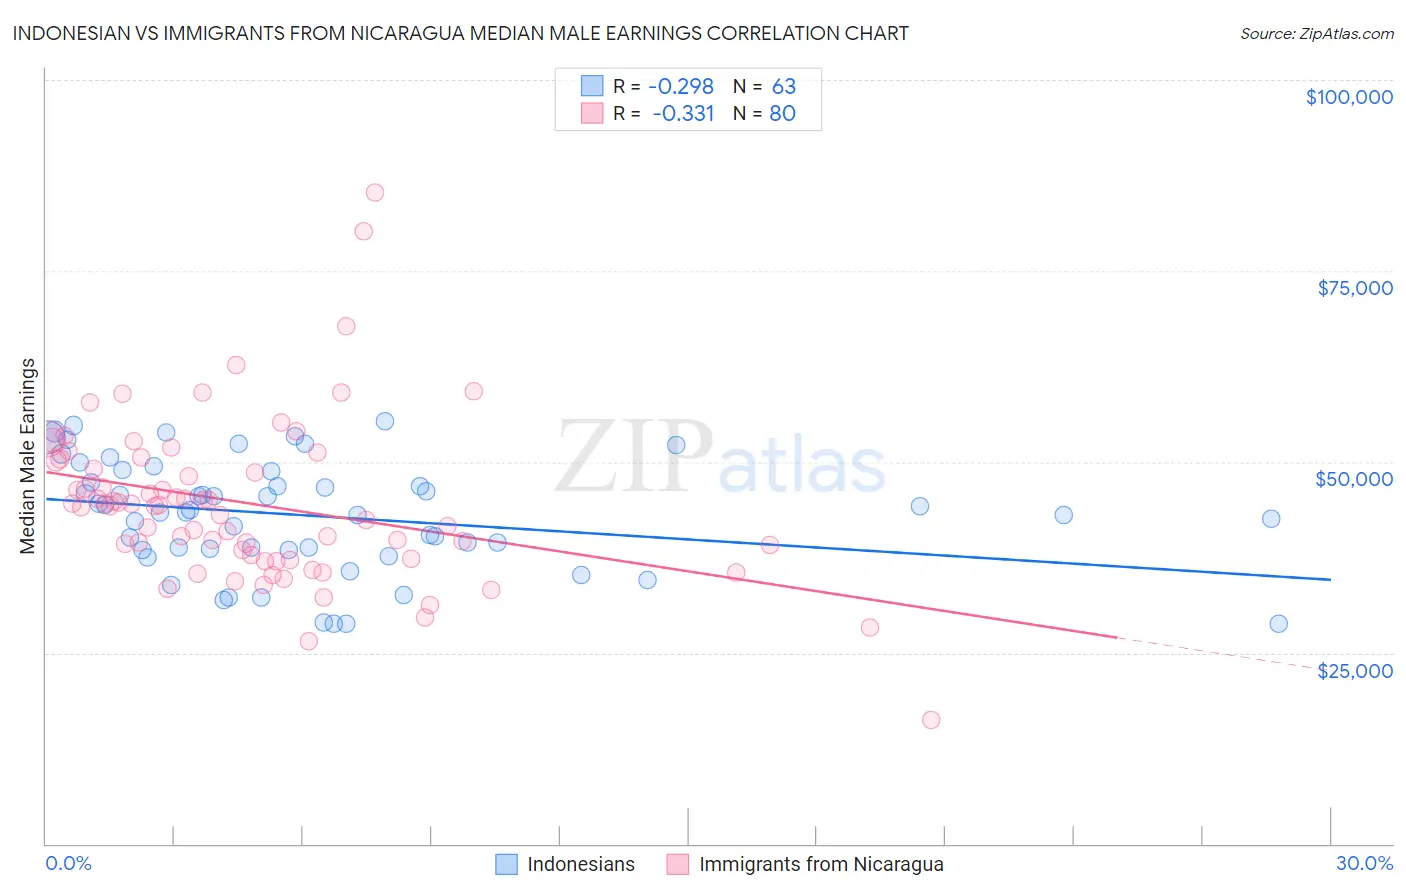
Indonesian vs Immigrants from Nicaragua Median Male Earnings Correlation Chart
The statistical analysis conducted on geographies consisting of 162,701,910 people shows a weak negative correlation between the proportion of Indonesians and median male earnings in the United States with a correlation coefficient (R) of -0.298 and weighted average of $47,503. Similarly, the statistical analysis conducted on geographies consisting of 236,305,617 people shows a mild negative correlation between the proportion of Immigrants from Nicaragua and median male earnings in the United States with a correlation coefficient (R) of -0.331 and weighted average of $47,482, a difference of 0.040%.
Median Male Earnings Correlation Summary
| Measurement | Indonesian | Immigrants from Nicaragua |
| Minimum | $28,857 | $16,250 |
| Maximum | $55,385 | $85,319 |
| Range | $26,528 | $69,069 |
| Mean | $42,970 | $44,541 |
| Median | $43,436 | $44,356 |
| Interquartile 25% (IQ1) | $38,534 | $37,535 |
| Interquartile 75% (IQ3) | $48,720 | $50,283 |
| Interquartile Range (IQR) | $10,186 | $12,748 |
| Standard Deviation (Sample) | $7,238 | $10,745 |
| Standard Deviation (Population) | $7,181 | $10,678 |
Demographics Similar to Indonesians and Immigrants from Nicaragua by Median Male Earnings
In terms of median male earnings, the demographic groups most similar to Indonesians are Central American Indian ($47,433, a difference of 0.15%), Immigrants from Dominica ($47,651, a difference of 0.31%), Inupiat ($47,281, a difference of 0.47%), Choctaw ($47,729, a difference of 0.48%), and Dominican ($47,204, a difference of 0.63%). Similarly, the demographic groups most similar to Immigrants from Nicaragua are Central American Indian ($47,433, a difference of 0.10%), Immigrants from Dominica ($47,651, a difference of 0.36%), Inupiat ($47,281, a difference of 0.43%), Choctaw ($47,729, a difference of 0.52%), and Dominican ($47,204, a difference of 0.59%).
| Demographics | Rating | Rank | Median Male Earnings |
| Immigrants | Jamaica | 0.2 /100 | #283 | Tragic $48,040 |
| Africans | 0.2 /100 | #284 | Tragic $47,994 |
| Paiute | 0.2 /100 | #285 | Tragic $47,991 |
| Mexican American Indians | 0.2 /100 | #286 | Tragic $47,990 |
| Immigrants | El Salvador | 0.2 /100 | #287 | Tragic $47,973 |
| Shoshone | 0.2 /100 | #288 | Tragic $47,930 |
| Chickasaw | 0.1 /100 | #289 | Tragic $47,832 |
| Immigrants | Belize | 0.1 /100 | #290 | Tragic $47,809 |
| Choctaw | 0.1 /100 | #291 | Tragic $47,729 |
| Immigrants | Dominica | 0.1 /100 | #292 | Tragic $47,651 |
| Indonesians | 0.1 /100 | #293 | Tragic $47,503 |
| Immigrants | Nicaragua | 0.1 /100 | #294 | Tragic $47,482 |
| Central American Indians | 0.1 /100 | #295 | Tragic $47,433 |
| Inupiat | 0.1 /100 | #296 | Tragic $47,281 |
| Dominicans | 0.1 /100 | #297 | Tragic $47,204 |
| Immigrants | Micronesia | 0.1 /100 | #298 | Tragic $47,177 |
| Immigrants | Zaire | 0.1 /100 | #299 | Tragic $47,070 |
| U.S. Virgin Islanders | 0.1 /100 | #300 | Tragic $47,066 |
| Immigrants | Latin America | 0.1 /100 | #301 | Tragic $46,941 |
| Seminole | 0.1 /100 | #302 | Tragic $46,783 |
| Yaqui | 0.1 /100 | #303 | Tragic $46,777 |