Senegalese vs Immigrants from Kuwait Median Male Earnings
COMPARE
Senegalese
Immigrants from Kuwait
Median Male Earnings
Median Male Earnings Comparison
Senegalese
Immigrants from Kuwait
$49,774
MEDIAN MALE EARNINGS
1.0/ 100
METRIC RATING
254th/ 347
METRIC RANK
$57,562
MEDIAN MALE EARNINGS
95.3/ 100
METRIC RATING
114th/ 347
METRIC RANK
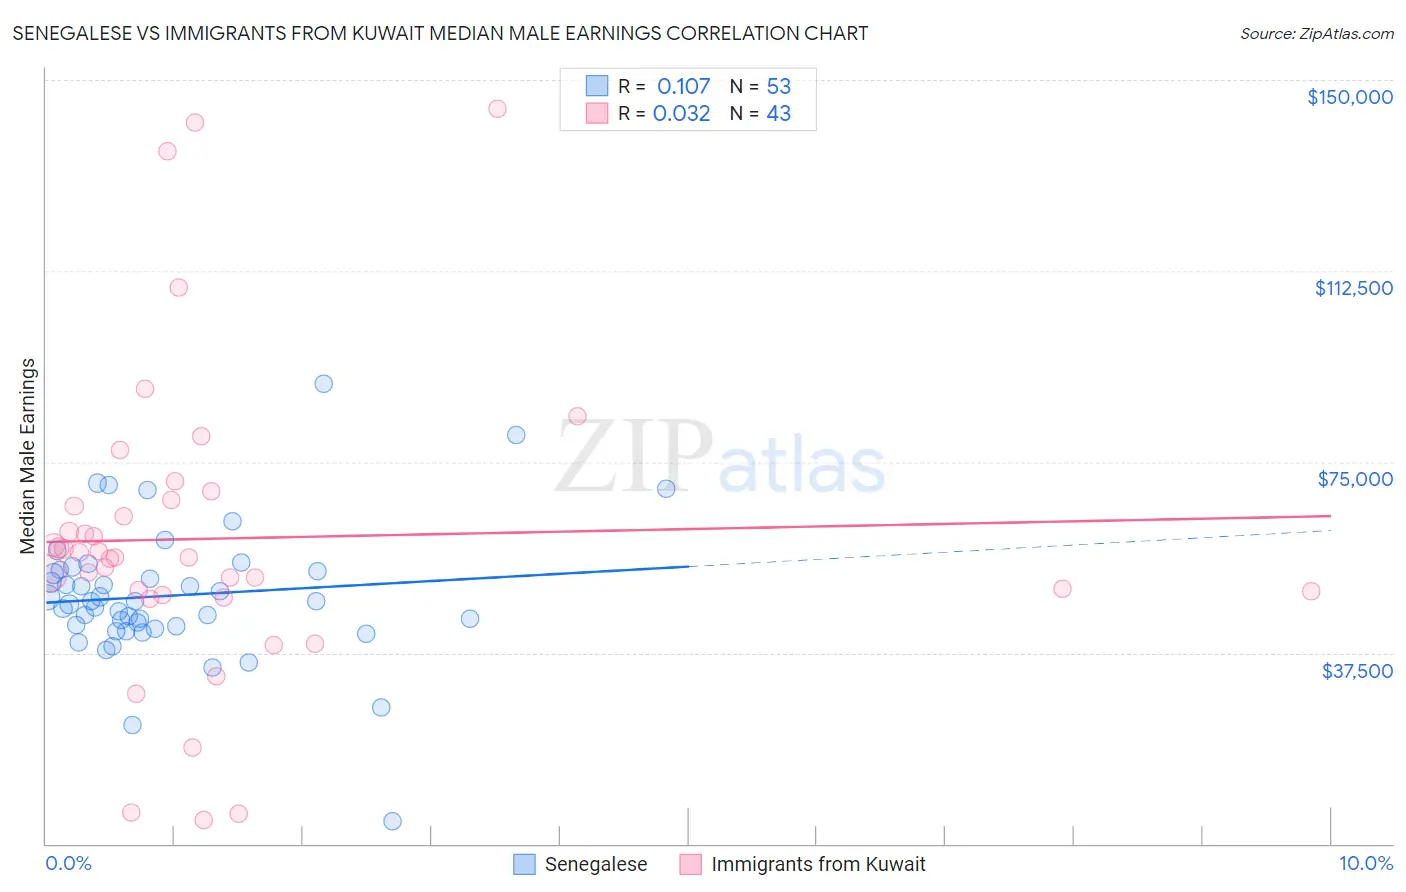
Senegalese vs Immigrants from Kuwait Median Male Earnings Correlation Chart
The statistical analysis conducted on geographies consisting of 78,104,359 people shows a poor positive correlation between the proportion of Senegalese and median male earnings in the United States with a correlation coefficient (R) of 0.107 and weighted average of $49,774. Similarly, the statistical analysis conducted on geographies consisting of 136,917,085 people shows no correlation between the proportion of Immigrants from Kuwait and median male earnings in the United States with a correlation coefficient (R) of 0.032 and weighted average of $57,562, a difference of 15.7%.
Median Male Earnings Correlation Summary
| Measurement | Senegalese | Immigrants from Kuwait |
| Minimum | $4,513 | $4,638 |
| Maximum | $90,259 | $144,236 |
| Range | $85,746 | $139,598 |
| Mean | $48,737 | $59,941 |
| Median | $47,653 | $56,335 |
| Interquartile 25% (IQ1) | $42,459 | $48,946 |
| Interquartile 75% (IQ3) | $53,697 | $67,515 |
| Interquartile Range (IQR) | $11,239 | $18,568 |
| Standard Deviation (Sample) | $13,453 | $30,286 |
| Standard Deviation (Population) | $13,326 | $29,932 |
Similar Demographics by Median Male Earnings
Demographics Similar to Senegalese by Median Male Earnings
In terms of median male earnings, the demographic groups most similar to Senegalese are Alaskan Athabascan ($49,748, a difference of 0.050%), Alaska Native ($49,711, a difference of 0.13%), British West Indian ($49,636, a difference of 0.28%), German Russian ($49,924, a difference of 0.30%), and Immigrants from Cabo Verde ($50,009, a difference of 0.47%).
| Demographics | Rating | Rank | Median Male Earnings |
| Sub-Saharan Africans | 1.8 /100 | #247 | Tragic $50,408 |
| Immigrants | Guyana | 1.6 /100 | #248 | Tragic $50,321 |
| Immigrants | Burma/Myanmar | 1.6 /100 | #249 | Tragic $50,298 |
| Osage | 1.6 /100 | #250 | Tragic $50,292 |
| Immigrants | Grenada | 1.6 /100 | #251 | Tragic $50,279 |
| Immigrants | Cabo Verde | 1.2 /100 | #252 | Tragic $50,009 |
| German Russians | 1.1 /100 | #253 | Tragic $49,924 |
| Senegalese | 1.0 /100 | #254 | Tragic $49,774 |
| Alaskan Athabascans | 0.9 /100 | #255 | Tragic $49,748 |
| Alaska Natives | 0.9 /100 | #256 | Tragic $49,711 |
| British West Indians | 0.8 /100 | #257 | Tragic $49,636 |
| Cree | 0.7 /100 | #258 | Tragic $49,497 |
| Nepalese | 0.7 /100 | #259 | Tragic $49,458 |
| Iroquois | 0.7 /100 | #260 | Tragic $49,374 |
| Liberians | 0.6 /100 | #261 | Tragic $49,318 |
Demographics Similar to Immigrants from Kuwait by Median Male Earnings
In terms of median male earnings, the demographic groups most similar to Immigrants from Kuwait are Carpatho Rusyn ($57,572, a difference of 0.020%), Immigrants from Afghanistan ($57,582, a difference of 0.040%), European ($57,637, a difference of 0.13%), Swedish ($57,445, a difference of 0.20%), and Lebanese ($57,409, a difference of 0.27%).
| Demographics | Rating | Rank | Median Male Earnings |
| Serbians | 96.8 /100 | #107 | Exceptional $57,975 |
| Immigrants | Uzbekistan | 96.7 /100 | #108 | Exceptional $57,941 |
| British | 96.5 /100 | #109 | Exceptional $57,890 |
| Palestinians | 96.2 /100 | #110 | Exceptional $57,778 |
| Europeans | 95.6 /100 | #111 | Exceptional $57,637 |
| Immigrants | Afghanistan | 95.4 /100 | #112 | Exceptional $57,582 |
| Carpatho Rusyns | 95.3 /100 | #113 | Exceptional $57,572 |
| Immigrants | Kuwait | 95.3 /100 | #114 | Exceptional $57,562 |
| Swedes | 94.8 /100 | #115 | Exceptional $57,445 |
| Lebanese | 94.6 /100 | #116 | Exceptional $57,409 |
| Immigrants | Zimbabwe | 94.3 /100 | #117 | Exceptional $57,352 |
| Hungarians | 94.0 /100 | #118 | Exceptional $57,309 |
| Arabs | 94.0 /100 | #119 | Exceptional $57,298 |
| Canadians | 93.9 /100 | #120 | Exceptional $57,286 |
| Immigrants | Albania | 93.3 /100 | #121 | Exceptional $57,179 |