Polish vs Navajo Median Female Earnings
COMPARE
Polish
Navajo
Median Female Earnings
Median Female Earnings Comparison
Poles
Navajo
$40,371
MEDIAN FEMALE EARNINGS
80.2/ 100
METRIC RATING
148th/ 347
METRIC RANK
$33,046
MEDIAN FEMALE EARNINGS
0.0/ 100
METRIC RATING
341st/ 347
METRIC RANK
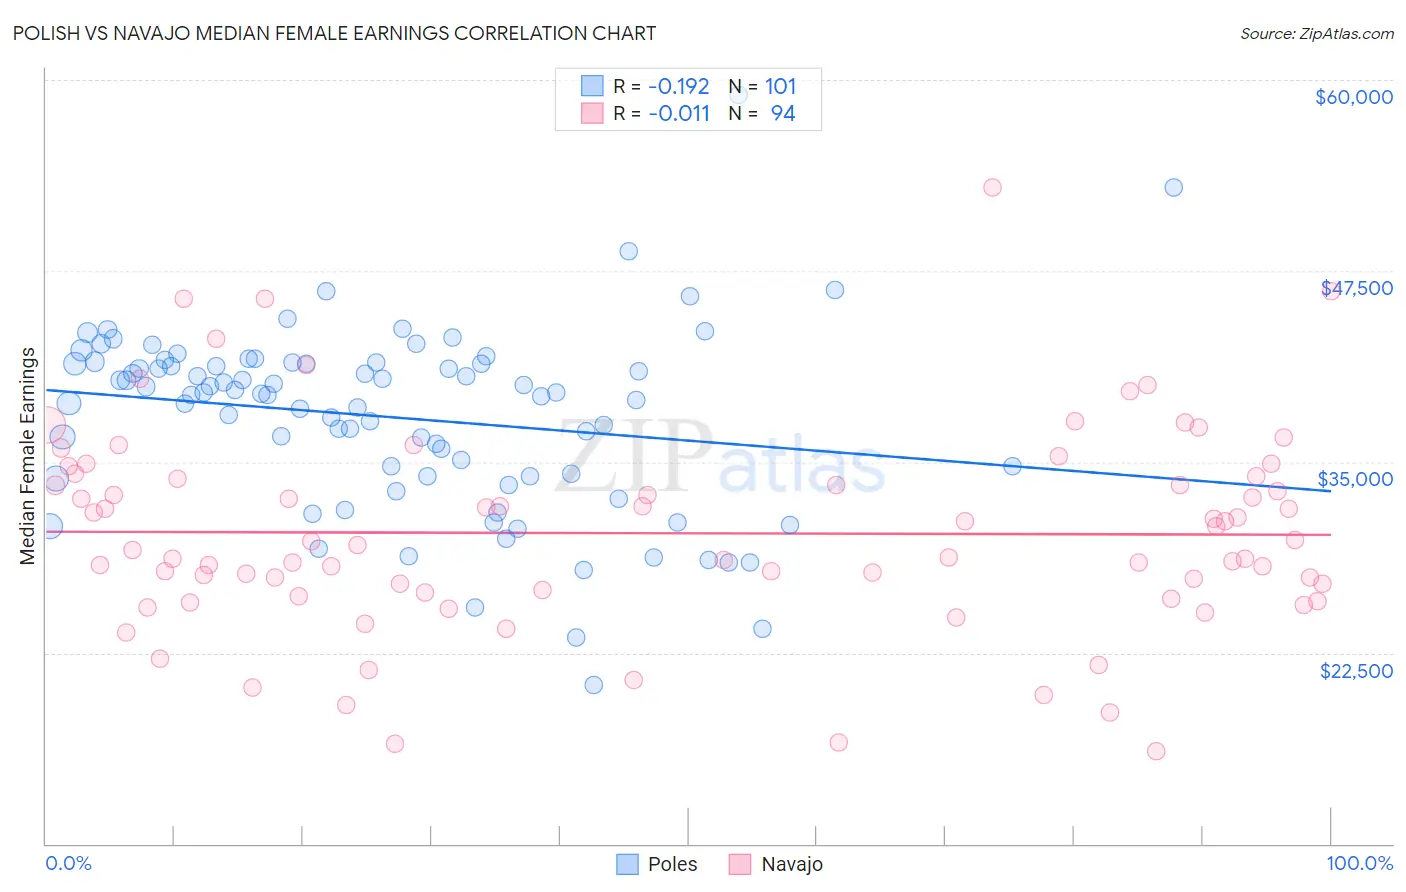
Polish vs Navajo Median Female Earnings Correlation Chart
The statistical analysis conducted on geographies consisting of 559,155,660 people shows a poor negative correlation between the proportion of Poles and median female earnings in the United States with a correlation coefficient (R) of -0.192 and weighted average of $40,371. Similarly, the statistical analysis conducted on geographies consisting of 224,729,121 people shows no correlation between the proportion of Navajo and median female earnings in the United States with a correlation coefficient (R) of -0.011 and weighted average of $33,046, a difference of 22.2%.
Median Female Earnings Correlation Summary
| Measurement | Polish | Navajo |
| Minimum | $20,398 | $16,070 |
| Maximum | $59,044 | $52,969 |
| Range | $38,646 | $36,899 |
| Mean | $37,935 | $30,327 |
| Median | $39,430 | $29,421 |
| Interquartile 25% (IQ1) | $34,072 | $26,466 |
| Interquartile 75% (IQ3) | $41,456 | $33,883 |
| Interquartile Range (IQR) | $7,385 | $7,417 |
| Standard Deviation (Sample) | $6,072 | $6,718 |
| Standard Deviation (Population) | $6,042 | $6,682 |
Similar Demographics by Median Female Earnings
Demographics Similar to Poles by Median Female Earnings
In terms of median female earnings, the demographic groups most similar to Poles are Vietnamese ($40,377, a difference of 0.020%), Immigrants from Cameroon ($40,354, a difference of 0.040%), Immigrants from Chile ($40,353, a difference of 0.040%), Immigrants from Armenia ($40,340, a difference of 0.080%), and West Indian ($40,317, a difference of 0.13%).
| Demographics | Rating | Rank | Median Female Earnings |
| Immigrants | Syria | 84.1 /100 | #141 | Excellent $40,499 |
| Sri Lankans | 84.0 /100 | #142 | Excellent $40,496 |
| Northern Europeans | 83.9 /100 | #143 | Excellent $40,491 |
| Immigrants | North Macedonia | 83.8 /100 | #144 | Excellent $40,488 |
| Brazilians | 83.6 /100 | #145 | Excellent $40,483 |
| Ghanaians | 82.1 /100 | #146 | Excellent $40,429 |
| Vietnamese | 80.4 /100 | #147 | Excellent $40,377 |
| Poles | 80.2 /100 | #148 | Excellent $40,371 |
| Immigrants | Cameroon | 79.7 /100 | #149 | Good $40,354 |
| Immigrants | Chile | 79.6 /100 | #150 | Good $40,353 |
| Immigrants | Armenia | 79.2 /100 | #151 | Good $40,340 |
| West Indians | 78.4 /100 | #152 | Good $40,317 |
| British West Indians | 77.7 /100 | #153 | Good $40,299 |
| Immigrants | Oceania | 77.6 /100 | #154 | Good $40,297 |
| Immigrants | Africa | 76.2 /100 | #155 | Good $40,257 |
Demographics Similar to Navajo by Median Female Earnings
In terms of median female earnings, the demographic groups most similar to Navajo are Tohono O'odham ($33,205, a difference of 0.48%), Immigrants from Mexico ($33,236, a difference of 0.57%), Immigrants from Cuba ($33,291, a difference of 0.74%), Yakama ($33,354, a difference of 0.93%), and Yup'ik ($32,730, a difference of 0.96%).
| Demographics | Rating | Rank | Median Female Earnings |
| Mexicans | 0.0 /100 | #333 | Tragic $33,664 |
| Spanish American Indians | 0.0 /100 | #334 | Tragic $33,625 |
| Creek | 0.0 /100 | #335 | Tragic $33,437 |
| Ottawa | 0.0 /100 | #336 | Tragic $33,378 |
| Yakama | 0.0 /100 | #337 | Tragic $33,354 |
| Immigrants | Cuba | 0.0 /100 | #338 | Tragic $33,291 |
| Immigrants | Mexico | 0.0 /100 | #339 | Tragic $33,236 |
| Tohono O'odham | 0.0 /100 | #340 | Tragic $33,205 |
| Navajo | 0.0 /100 | #341 | Tragic $33,046 |
| Yup'ik | 0.0 /100 | #342 | Tragic $32,730 |
| Pueblo | 0.0 /100 | #343 | Tragic $32,564 |
| Lumbee | 0.0 /100 | #344 | Tragic $32,500 |
| Puerto Ricans | 0.0 /100 | #345 | Tragic $31,560 |
| Arapaho | 0.0 /100 | #346 | Tragic $31,489 |
| Houma | 0.0 /100 | #347 | Tragic $30,343 |