Polish vs Immigrants from Scotland Median Female Earnings
COMPARE
Polish
Immigrants from Scotland
Median Female Earnings
Median Female Earnings Comparison
Poles
Immigrants from Scotland
$40,371
MEDIAN FEMALE EARNINGS
80.2/ 100
METRIC RATING
148th/ 347
METRIC RANK
$41,771
MEDIAN FEMALE EARNINGS
98.7/ 100
METRIC RATING
98th/ 347
METRIC RANK
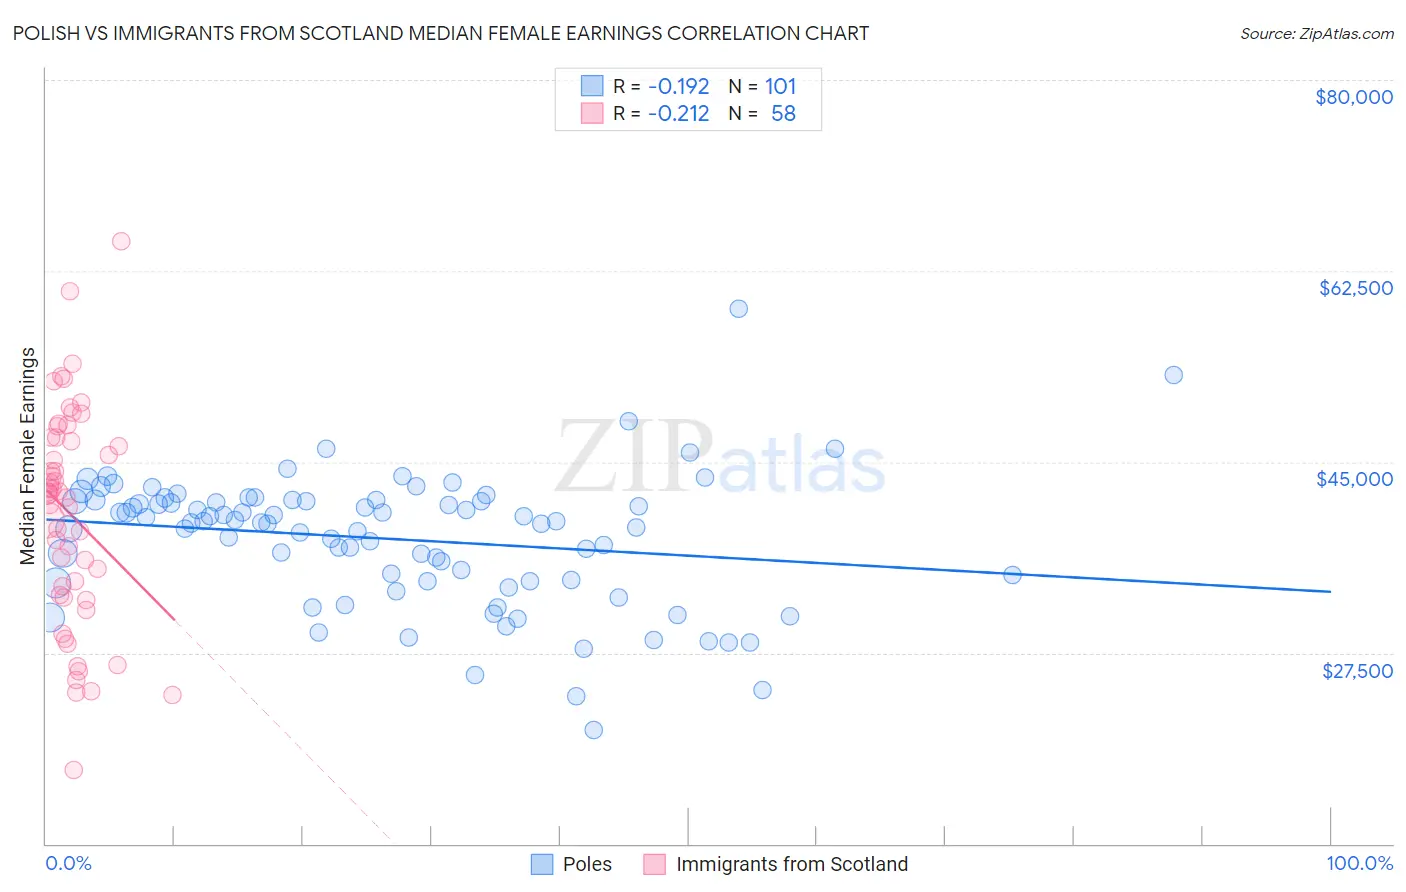
Polish vs Immigrants from Scotland Median Female Earnings Correlation Chart
The statistical analysis conducted on geographies consisting of 559,155,660 people shows a poor negative correlation between the proportion of Poles and median female earnings in the United States with a correlation coefficient (R) of -0.192 and weighted average of $40,371. Similarly, the statistical analysis conducted on geographies consisting of 196,348,950 people shows a weak negative correlation between the proportion of Immigrants from Scotland and median female earnings in the United States with a correlation coefficient (R) of -0.212 and weighted average of $41,771, a difference of 3.5%.
Median Female Earnings Correlation Summary
| Measurement | Polish | Immigrants from Scotland |
| Minimum | $20,398 | $16,733 |
| Maximum | $59,044 | $65,203 |
| Range | $38,646 | $48,470 |
| Mean | $37,935 | $40,188 |
| Median | $39,430 | $42,027 |
| Interquartile 25% (IQ1) | $34,072 | $32,757 |
| Interquartile 75% (IQ3) | $41,456 | $47,181 |
| Interquartile Range (IQR) | $7,385 | $14,424 |
| Standard Deviation (Sample) | $6,072 | $9,888 |
| Standard Deviation (Population) | $6,042 | $9,803 |
Similar Demographics by Median Female Earnings
Demographics Similar to Poles by Median Female Earnings
In terms of median female earnings, the demographic groups most similar to Poles are Vietnamese ($40,377, a difference of 0.020%), Immigrants from Cameroon ($40,354, a difference of 0.040%), Immigrants from Chile ($40,353, a difference of 0.040%), Immigrants from Armenia ($40,340, a difference of 0.080%), and West Indian ($40,317, a difference of 0.13%).
| Demographics | Rating | Rank | Median Female Earnings |
| Immigrants | Syria | 84.1 /100 | #141 | Excellent $40,499 |
| Sri Lankans | 84.0 /100 | #142 | Excellent $40,496 |
| Northern Europeans | 83.9 /100 | #143 | Excellent $40,491 |
| Immigrants | North Macedonia | 83.8 /100 | #144 | Excellent $40,488 |
| Brazilians | 83.6 /100 | #145 | Excellent $40,483 |
| Ghanaians | 82.1 /100 | #146 | Excellent $40,429 |
| Vietnamese | 80.4 /100 | #147 | Excellent $40,377 |
| Poles | 80.2 /100 | #148 | Excellent $40,371 |
| Immigrants | Cameroon | 79.7 /100 | #149 | Good $40,354 |
| Immigrants | Chile | 79.6 /100 | #150 | Good $40,353 |
| Immigrants | Armenia | 79.2 /100 | #151 | Good $40,340 |
| West Indians | 78.4 /100 | #152 | Good $40,317 |
| British West Indians | 77.7 /100 | #153 | Good $40,299 |
| Immigrants | Oceania | 77.6 /100 | #154 | Good $40,297 |
| Immigrants | Africa | 76.2 /100 | #155 | Good $40,257 |
Demographics Similar to Immigrants from Scotland by Median Female Earnings
In terms of median female earnings, the demographic groups most similar to Immigrants from Scotland are Immigrants from Hungary ($41,820, a difference of 0.12%), South African ($41,825, a difference of 0.13%), Immigrants from Barbados ($41,685, a difference of 0.21%), Moroccan ($41,872, a difference of 0.24%), and Immigrants from Netherlands ($41,870, a difference of 0.24%).
| Demographics | Rating | Rank | Median Female Earnings |
| Immigrants | Western Europe | 99.2 /100 | #91 | Exceptional $41,990 |
| Argentineans | 99.1 /100 | #92 | Exceptional $41,952 |
| Immigrants | Grenada | 99.0 /100 | #93 | Exceptional $41,932 |
| Moroccans | 98.9 /100 | #94 | Exceptional $41,872 |
| Immigrants | Netherlands | 98.9 /100 | #95 | Exceptional $41,870 |
| South Africans | 98.8 /100 | #96 | Exceptional $41,825 |
| Immigrants | Hungary | 98.8 /100 | #97 | Exceptional $41,820 |
| Immigrants | Scotland | 98.7 /100 | #98 | Exceptional $41,771 |
| Immigrants | Barbados | 98.4 /100 | #99 | Exceptional $41,685 |
| Romanians | 98.3 /100 | #100 | Exceptional $41,663 |
| Immigrants | Fiji | 98.3 /100 | #101 | Exceptional $41,656 |
| Immigrants | Poland | 98.2 /100 | #102 | Exceptional $41,630 |
| Immigrants | Argentina | 97.9 /100 | #103 | Exceptional $41,554 |
| Immigrants | Zimbabwe | 97.8 /100 | #104 | Exceptional $41,527 |
| Italians | 97.7 /100 | #105 | Exceptional $41,505 |