Polish vs British Median Female Earnings
COMPARE
Polish
British
Median Female Earnings
Median Female Earnings Comparison
Poles
British
$40,371
MEDIAN FEMALE EARNINGS
80.2/ 100
METRIC RATING
148th/ 347
METRIC RANK
$39,772
MEDIAN FEMALE EARNINGS
53.8/ 100
METRIC RATING
172nd/ 347
METRIC RANK
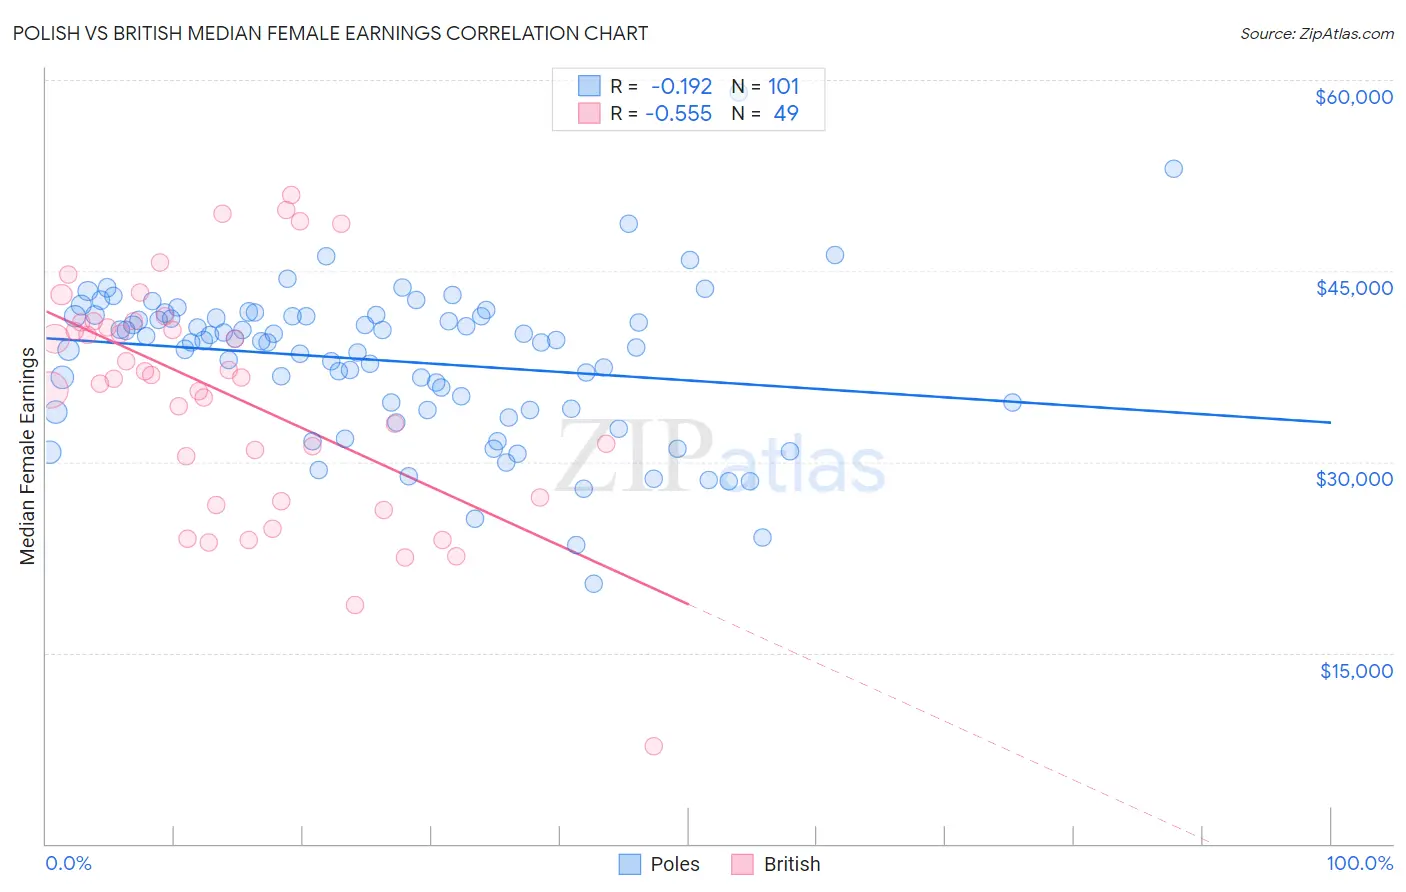
Polish vs British Median Female Earnings Correlation Chart
The statistical analysis conducted on geographies consisting of 559,155,660 people shows a poor negative correlation between the proportion of Poles and median female earnings in the United States with a correlation coefficient (R) of -0.192 and weighted average of $40,371. Similarly, the statistical analysis conducted on geographies consisting of 530,644,409 people shows a substantial negative correlation between the proportion of British and median female earnings in the United States with a correlation coefficient (R) of -0.555 and weighted average of $39,772, a difference of 1.5%.
Median Female Earnings Correlation Summary
| Measurement | Polish | British |
| Minimum | $20,398 | $7,631 |
| Maximum | $59,044 | $50,972 |
| Range | $38,646 | $43,341 |
| Mean | $37,935 | $35,190 |
| Median | $39,430 | $36,667 |
| Interquartile 25% (IQ1) | $34,072 | $27,044 |
| Interquartile 75% (IQ3) | $41,456 | $41,037 |
| Interquartile Range (IQR) | $7,385 | $13,994 |
| Standard Deviation (Sample) | $6,072 | $9,173 |
| Standard Deviation (Population) | $6,042 | $9,079 |
Similar Demographics by Median Female Earnings
Demographics Similar to Poles by Median Female Earnings
In terms of median female earnings, the demographic groups most similar to Poles are Vietnamese ($40,377, a difference of 0.020%), Immigrants from Cameroon ($40,354, a difference of 0.040%), Immigrants from Chile ($40,353, a difference of 0.040%), Immigrants from Armenia ($40,340, a difference of 0.080%), and West Indian ($40,317, a difference of 0.13%).
| Demographics | Rating | Rank | Median Female Earnings |
| Immigrants | Syria | 84.1 /100 | #141 | Excellent $40,499 |
| Sri Lankans | 84.0 /100 | #142 | Excellent $40,496 |
| Northern Europeans | 83.9 /100 | #143 | Excellent $40,491 |
| Immigrants | North Macedonia | 83.8 /100 | #144 | Excellent $40,488 |
| Brazilians | 83.6 /100 | #145 | Excellent $40,483 |
| Ghanaians | 82.1 /100 | #146 | Excellent $40,429 |
| Vietnamese | 80.4 /100 | #147 | Excellent $40,377 |
| Poles | 80.2 /100 | #148 | Excellent $40,371 |
| Immigrants | Cameroon | 79.7 /100 | #149 | Good $40,354 |
| Immigrants | Chile | 79.6 /100 | #150 | Good $40,353 |
| Immigrants | Armenia | 79.2 /100 | #151 | Good $40,340 |
| West Indians | 78.4 /100 | #152 | Good $40,317 |
| British West Indians | 77.7 /100 | #153 | Good $40,299 |
| Immigrants | Oceania | 77.6 /100 | #154 | Good $40,297 |
| Immigrants | Africa | 76.2 /100 | #155 | Good $40,257 |
Demographics Similar to British by Median Female Earnings
In terms of median female earnings, the demographic groups most similar to British are Immigrants from Portugal ($39,788, a difference of 0.040%), Slovene ($39,817, a difference of 0.11%), Canadian ($39,724, a difference of 0.12%), South American ($39,698, a difference of 0.19%), and Kenyan ($39,860, a difference of 0.22%).
| Demographics | Rating | Rank | Median Female Earnings |
| Immigrants | Bangladesh | 60.8 /100 | #165 | Good $39,910 |
| Immigrants | Ghana | 60.0 /100 | #166 | Good $39,894 |
| Luxembourgers | 59.9 /100 | #167 | Average $39,891 |
| Immigrants | Peru | 58.9 /100 | #168 | Average $39,871 |
| Kenyans | 58.4 /100 | #169 | Average $39,860 |
| Slovenes | 56.2 /100 | #170 | Average $39,817 |
| Immigrants | Portugal | 54.7 /100 | #171 | Average $39,788 |
| British | 53.8 /100 | #172 | Average $39,772 |
| Canadians | 51.4 /100 | #173 | Average $39,724 |
| South Americans | 50.0 /100 | #174 | Average $39,698 |
| Immigrants | South America | 47.2 /100 | #175 | Average $39,643 |
| Nigerians | 47.0 /100 | #176 | Average $39,641 |
| Costa Ricans | 46.1 /100 | #177 | Average $39,622 |
| Slavs | 45.6 /100 | #178 | Average $39,613 |
| Immigrants | Germany | 45.1 /100 | #179 | Average $39,603 |