Comanche vs Immigrants from Uruguay Median Female Earnings
COMPARE
Comanche
Immigrants from Uruguay
Median Female Earnings
Median Female Earnings Comparison
Comanche
Immigrants from Uruguay
$35,661
MEDIAN FEMALE EARNINGS
0.0/ 100
METRIC RATING
295th/ 347
METRIC RANK
$38,945
MEDIAN FEMALE EARNINGS
17.3/ 100
METRIC RATING
204th/ 347
METRIC RANK
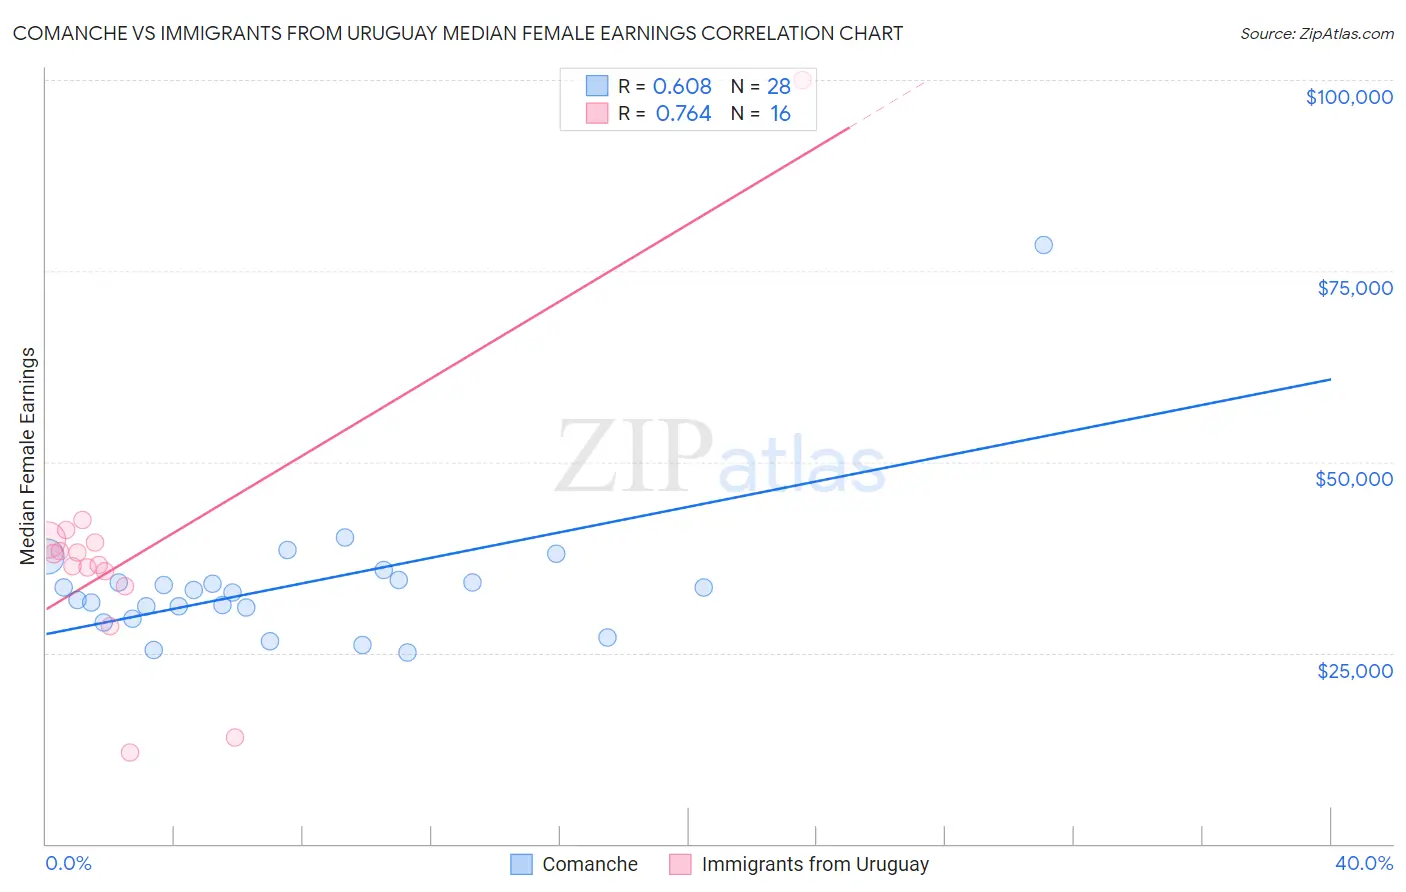
Comanche vs Immigrants from Uruguay Median Female Earnings Correlation Chart
The statistical analysis conducted on geographies consisting of 109,756,357 people shows a significant positive correlation between the proportion of Comanche and median female earnings in the United States with a correlation coefficient (R) of 0.608 and weighted average of $35,661. Similarly, the statistical analysis conducted on geographies consisting of 133,253,998 people shows a strong positive correlation between the proportion of Immigrants from Uruguay and median female earnings in the United States with a correlation coefficient (R) of 0.764 and weighted average of $38,945, a difference of 9.2%.
Median Female Earnings Correlation Summary
| Measurement | Comanche | Immigrants from Uruguay |
| Minimum | $25,100 | $12,017 |
| Maximum | $78,452 | $100,000 |
| Range | $53,352 | $87,983 |
| Mean | $33,877 | $38,117 |
| Median | $33,076 | $37,217 |
| Interquartile 25% (IQ1) | $30,131 | $34,685 |
| Interquartile 75% (IQ3) | $34,372 | $39,605 |
| Interquartile Range (IQR) | $4,241 | $4,920 |
| Standard Deviation (Sample) | $9,585 | $18,714 |
| Standard Deviation (Population) | $9,413 | $18,119 |
Similar Demographics by Median Female Earnings
Demographics Similar to Comanche by Median Female Earnings
In terms of median female earnings, the demographic groups most similar to Comanche are Cheyenne ($35,673, a difference of 0.030%), Guatemalan ($35,695, a difference of 0.090%), Mexican American Indian ($35,629, a difference of 0.090%), American ($35,777, a difference of 0.32%), and Hmong ($35,498, a difference of 0.46%).
| Demographics | Rating | Rank | Median Female Earnings |
| Immigrants | Zaire | 0.0 /100 | #288 | Tragic $36,017 |
| Bangladeshis | 0.0 /100 | #289 | Tragic $35,960 |
| Central American Indians | 0.0 /100 | #290 | Tragic $35,930 |
| Blackfeet | 0.0 /100 | #291 | Tragic $35,864 |
| Americans | 0.0 /100 | #292 | Tragic $35,777 |
| Guatemalans | 0.0 /100 | #293 | Tragic $35,695 |
| Cheyenne | 0.0 /100 | #294 | Tragic $35,673 |
| Comanche | 0.0 /100 | #295 | Tragic $35,661 |
| Mexican American Indians | 0.0 /100 | #296 | Tragic $35,629 |
| Hmong | 0.0 /100 | #297 | Tragic $35,498 |
| Immigrants | Micronesia | 0.0 /100 | #298 | Tragic $35,477 |
| Immigrants | Guatemala | 0.0 /100 | #299 | Tragic $35,444 |
| Yuman | 0.0 /100 | #300 | Tragic $35,377 |
| Pima | 0.0 /100 | #301 | Tragic $35,326 |
| Blacks/African Americans | 0.0 /100 | #302 | Tragic $35,315 |
Demographics Similar to Immigrants from Uruguay by Median Female Earnings
In terms of median female earnings, the demographic groups most similar to Immigrants from Uruguay are Immigrants from Colombia ($38,913, a difference of 0.080%), Czech ($38,992, a difference of 0.12%), Immigrants from Bosnia and Herzegovina ($38,886, a difference of 0.15%), Slovak ($39,029, a difference of 0.22%), and Immigrants from Panama ($39,049, a difference of 0.27%).
| Demographics | Rating | Rank | Median Female Earnings |
| Assyrians/Chaldeans/Syriacs | 24.6 /100 | #197 | Fair $39,159 |
| Ecuadorians | 23.0 /100 | #198 | Fair $39,117 |
| Icelanders | 22.7 /100 | #199 | Fair $39,109 |
| Immigrants | Panama | 20.6 /100 | #200 | Fair $39,049 |
| Panamanians | 20.6 /100 | #201 | Fair $39,049 |
| Slovaks | 19.9 /100 | #202 | Poor $39,029 |
| Czechs | 18.7 /100 | #203 | Poor $38,992 |
| Immigrants | Uruguay | 17.3 /100 | #204 | Poor $38,945 |
| Immigrants | Colombia | 16.3 /100 | #205 | Poor $38,913 |
| Immigrants | Bosnia and Herzegovina | 15.6 /100 | #206 | Poor $38,886 |
| Immigrants | Cambodia | 14.2 /100 | #207 | Poor $38,833 |
| Immigrants | Thailand | 13.6 /100 | #208 | Poor $38,810 |
| Norwegians | 13.4 /100 | #209 | Poor $38,802 |
| Czechoslovakians | 12.0 /100 | #210 | Poor $38,738 |
| Aleuts | 11.6 /100 | #211 | Poor $38,719 |