Polish vs Immigrants from Singapore Median Female Earnings
COMPARE
Polish
Immigrants from Singapore
Median Female Earnings
Median Female Earnings Comparison
Poles
Immigrants from Singapore
$40,371
MEDIAN FEMALE EARNINGS
80.2/ 100
METRIC RATING
148th/ 347
METRIC RANK
$47,986
MEDIAN FEMALE EARNINGS
100.0/ 100
METRIC RATING
5th/ 347
METRIC RANK
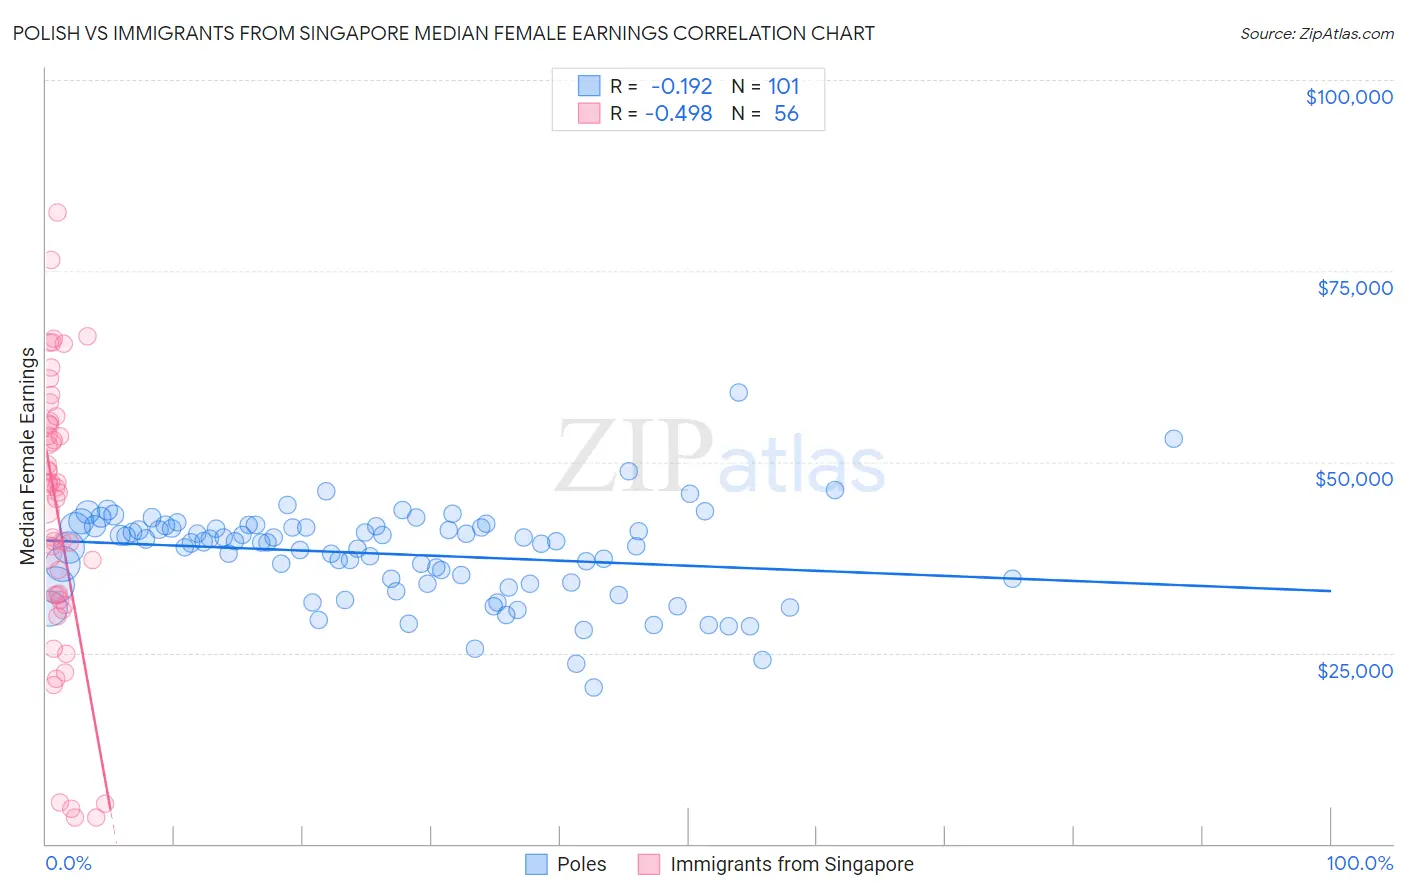
Polish vs Immigrants from Singapore Median Female Earnings Correlation Chart
The statistical analysis conducted on geographies consisting of 559,155,660 people shows a poor negative correlation between the proportion of Poles and median female earnings in the United States with a correlation coefficient (R) of -0.192 and weighted average of $40,371. Similarly, the statistical analysis conducted on geographies consisting of 137,511,050 people shows a moderate negative correlation between the proportion of Immigrants from Singapore and median female earnings in the United States with a correlation coefficient (R) of -0.498 and weighted average of $47,986, a difference of 18.9%.
Median Female Earnings Correlation Summary
| Measurement | Polish | Immigrants from Singapore |
| Minimum | $20,398 | $3,385 |
| Maximum | $59,044 | $82,574 |
| Range | $38,646 | $79,189 |
| Mean | $37,935 | $42,827 |
| Median | $39,430 | $46,291 |
| Interquartile 25% (IQ1) | $34,072 | $32,188 |
| Interquartile 75% (IQ3) | $41,456 | $54,889 |
| Interquartile Range (IQR) | $7,385 | $22,702 |
| Standard Deviation (Sample) | $6,072 | $18,237 |
| Standard Deviation (Population) | $6,042 | $18,074 |
Similar Demographics by Median Female Earnings
Demographics Similar to Poles by Median Female Earnings
In terms of median female earnings, the demographic groups most similar to Poles are Vietnamese ($40,377, a difference of 0.020%), Immigrants from Cameroon ($40,354, a difference of 0.040%), Immigrants from Chile ($40,353, a difference of 0.040%), Immigrants from Armenia ($40,340, a difference of 0.080%), and West Indian ($40,317, a difference of 0.13%).
| Demographics | Rating | Rank | Median Female Earnings |
| Immigrants | Syria | 84.1 /100 | #141 | Excellent $40,499 |
| Sri Lankans | 84.0 /100 | #142 | Excellent $40,496 |
| Northern Europeans | 83.9 /100 | #143 | Excellent $40,491 |
| Immigrants | North Macedonia | 83.8 /100 | #144 | Excellent $40,488 |
| Brazilians | 83.6 /100 | #145 | Excellent $40,483 |
| Ghanaians | 82.1 /100 | #146 | Excellent $40,429 |
| Vietnamese | 80.4 /100 | #147 | Excellent $40,377 |
| Poles | 80.2 /100 | #148 | Excellent $40,371 |
| Immigrants | Cameroon | 79.7 /100 | #149 | Good $40,354 |
| Immigrants | Chile | 79.6 /100 | #150 | Good $40,353 |
| Immigrants | Armenia | 79.2 /100 | #151 | Good $40,340 |
| West Indians | 78.4 /100 | #152 | Good $40,317 |
| British West Indians | 77.7 /100 | #153 | Good $40,299 |
| Immigrants | Oceania | 77.6 /100 | #154 | Good $40,297 |
| Immigrants | Africa | 76.2 /100 | #155 | Good $40,257 |
Demographics Similar to Immigrants from Singapore by Median Female Earnings
In terms of median female earnings, the demographic groups most similar to Immigrants from Singapore are Immigrants from India ($48,292, a difference of 0.64%), Immigrants from Ireland ($47,598, a difference of 0.82%), Thai ($47,577, a difference of 0.86%), Iranian ($47,421, a difference of 1.2%), and Immigrants from Iran ($47,154, a difference of 1.8%).
| Demographics | Rating | Rank | Median Female Earnings |
| Immigrants | Hong Kong | 100.0 /100 | #1 | Exceptional $49,818 |
| Filipinos | 100.0 /100 | #2 | Exceptional $49,508 |
| Immigrants | Taiwan | 100.0 /100 | #3 | Exceptional $49,256 |
| Immigrants | India | 100.0 /100 | #4 | Exceptional $48,292 |
| Immigrants | Singapore | 100.0 /100 | #5 | Exceptional $47,986 |
| Immigrants | Ireland | 100.0 /100 | #6 | Exceptional $47,598 |
| Thais | 100.0 /100 | #7 | Exceptional $47,577 |
| Iranians | 100.0 /100 | #8 | Exceptional $47,421 |
| Immigrants | Iran | 100.0 /100 | #9 | Exceptional $47,154 |
| Immigrants | China | 100.0 /100 | #10 | Exceptional $46,972 |
| Okinawans | 100.0 /100 | #11 | Exceptional $46,905 |
| Immigrants | Israel | 100.0 /100 | #12 | Exceptional $46,902 |
| Immigrants | Australia | 100.0 /100 | #13 | Exceptional $46,573 |
| Soviet Union | 100.0 /100 | #14 | Exceptional $46,556 |
| Immigrants | Eastern Asia | 100.0 /100 | #15 | Exceptional $46,502 |