Nigerian vs Immigrants from Syria Median Family Income
COMPARE
Nigerian
Immigrants from Syria
Median Family Income
Median Family Income Comparison
Nigerians
Immigrants from Syria
$97,522
MEDIAN FAMILY INCOME
6.7/ 100
METRIC RATING
215th/ 347
METRIC RANK
$106,118
MEDIAN FAMILY INCOME
85.3/ 100
METRIC RATING
141st/ 347
METRIC RANK
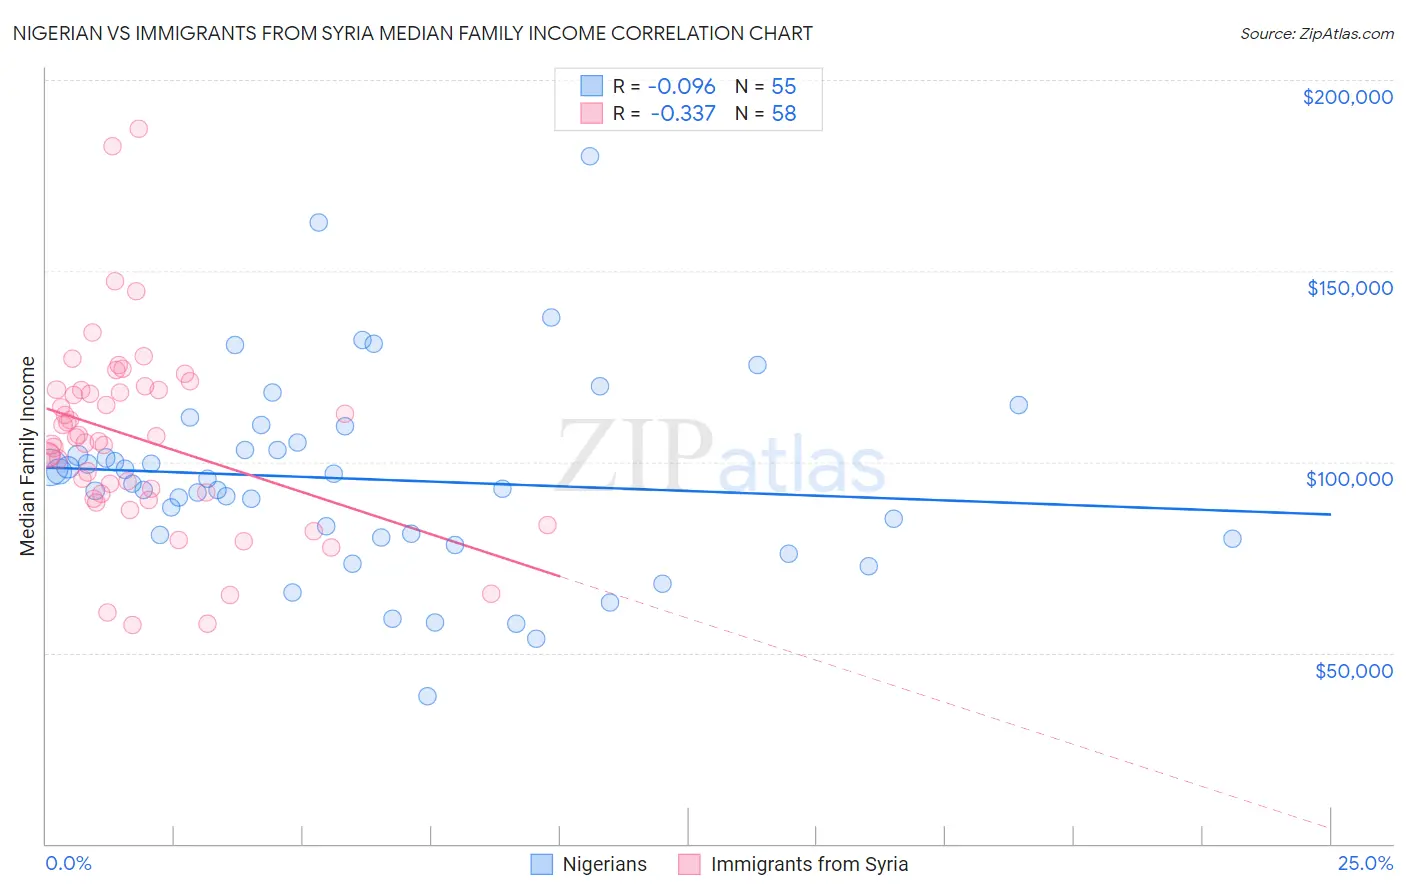
Nigerian vs Immigrants from Syria Median Family Income Correlation Chart
The statistical analysis conducted on geographies consisting of 332,335,879 people shows a slight negative correlation between the proportion of Nigerians and median family income in the United States with a correlation coefficient (R) of -0.096 and weighted average of $97,522. Similarly, the statistical analysis conducted on geographies consisting of 174,073,283 people shows a mild negative correlation between the proportion of Immigrants from Syria and median family income in the United States with a correlation coefficient (R) of -0.337 and weighted average of $106,118, a difference of 8.8%.
Median Family Income Correlation Summary
| Measurement | Nigerian | Immigrants from Syria |
| Minimum | $38,750 | $57,198 |
| Maximum | $179,905 | $187,321 |
| Range | $141,155 | $130,123 |
| Mean | $95,484 | $106,113 |
| Median | $94,247 | $105,890 |
| Interquartile 25% (IQ1) | $80,166 | $91,647 |
| Interquartile 75% (IQ3) | $105,230 | $118,687 |
| Interquartile Range (IQR) | $25,063 | $27,040 |
| Standard Deviation (Sample) | $25,645 | $25,104 |
| Standard Deviation (Population) | $25,411 | $24,886 |
Similar Demographics by Median Family Income
Demographics Similar to Nigerians by Median Family Income
In terms of median family income, the demographic groups most similar to Nigerians are Bermudan ($97,577, a difference of 0.060%), Immigrants from Armenia ($97,605, a difference of 0.090%), Immigrants from Bosnia and Herzegovina ($97,432, a difference of 0.090%), Panamanian ($97,683, a difference of 0.17%), and Immigrants from Sudan ($97,737, a difference of 0.22%).
| Demographics | Rating | Rank | Median Family Income |
| Immigrants | Uruguay | 9.2 /100 | #208 | Tragic $98,205 |
| Immigrants | Colombia | 8.7 /100 | #209 | Tragic $98,067 |
| Puget Sound Salish | 8.2 /100 | #210 | Tragic $97,958 |
| Immigrants | Sudan | 7.4 /100 | #211 | Tragic $97,737 |
| Panamanians | 7.2 /100 | #212 | Tragic $97,683 |
| Immigrants | Armenia | 7.0 /100 | #213 | Tragic $97,605 |
| Bermudans | 6.9 /100 | #214 | Tragic $97,577 |
| Nigerians | 6.7 /100 | #215 | Tragic $97,522 |
| Immigrants | Bosnia and Herzegovina | 6.4 /100 | #216 | Tragic $97,432 |
| Japanese | 6.0 /100 | #217 | Tragic $97,288 |
| Immigrants | Cambodia | 5.8 /100 | #218 | Tragic $97,222 |
| Delaware | 5.1 /100 | #219 | Tragic $96,958 |
| Sudanese | 4.7 /100 | #220 | Tragic $96,783 |
| Immigrants | Ghana | 4.2 /100 | #221 | Tragic $96,544 |
| Immigrants | Nigeria | 4.0 /100 | #222 | Tragic $96,439 |
Demographics Similar to Immigrants from Syria by Median Family Income
In terms of median family income, the demographic groups most similar to Immigrants from Syria are Norwegian ($106,144, a difference of 0.020%), Immigrants from Vietnam ($106,186, a difference of 0.060%), Luxembourger ($106,183, a difference of 0.060%), Immigrants from Uganda ($106,188, a difference of 0.070%), and Slovene ($106,020, a difference of 0.090%).
| Demographics | Rating | Rank | Median Family Income |
| Immigrants | Oceania | 87.3 /100 | #134 | Excellent $106,453 |
| Portuguese | 86.3 /100 | #135 | Excellent $106,286 |
| Immigrants | South Eastern Asia | 86.1 /100 | #136 | Excellent $106,252 |
| Immigrants | Uganda | 85.7 /100 | #137 | Excellent $106,188 |
| Immigrants | Vietnam | 85.7 /100 | #138 | Excellent $106,186 |
| Luxembourgers | 85.7 /100 | #139 | Excellent $106,183 |
| Norwegians | 85.5 /100 | #140 | Excellent $106,144 |
| Immigrants | Syria | 85.3 /100 | #141 | Excellent $106,118 |
| Slovenes | 84.7 /100 | #142 | Excellent $106,020 |
| Tongans | 84.3 /100 | #143 | Excellent $105,967 |
| Immigrants | Morocco | 84.3 /100 | #144 | Excellent $105,964 |
| Danes | 83.8 /100 | #145 | Excellent $105,900 |
| Czechs | 83.4 /100 | #146 | Excellent $105,839 |
| Immigrants | Chile | 82.1 /100 | #147 | Excellent $105,655 |
| Hungarians | 81.7 /100 | #148 | Excellent $105,609 |