Scottish vs Immigrants from Syria Median Family Income
COMPARE
Scottish
Immigrants from Syria
Median Family Income
Median Family Income Comparison
Scottish
Immigrants from Syria
$104,288
MEDIAN FAMILY INCOME
69.5/ 100
METRIC RATING
160th/ 347
METRIC RANK
$106,118
MEDIAN FAMILY INCOME
85.3/ 100
METRIC RATING
141st/ 347
METRIC RANK
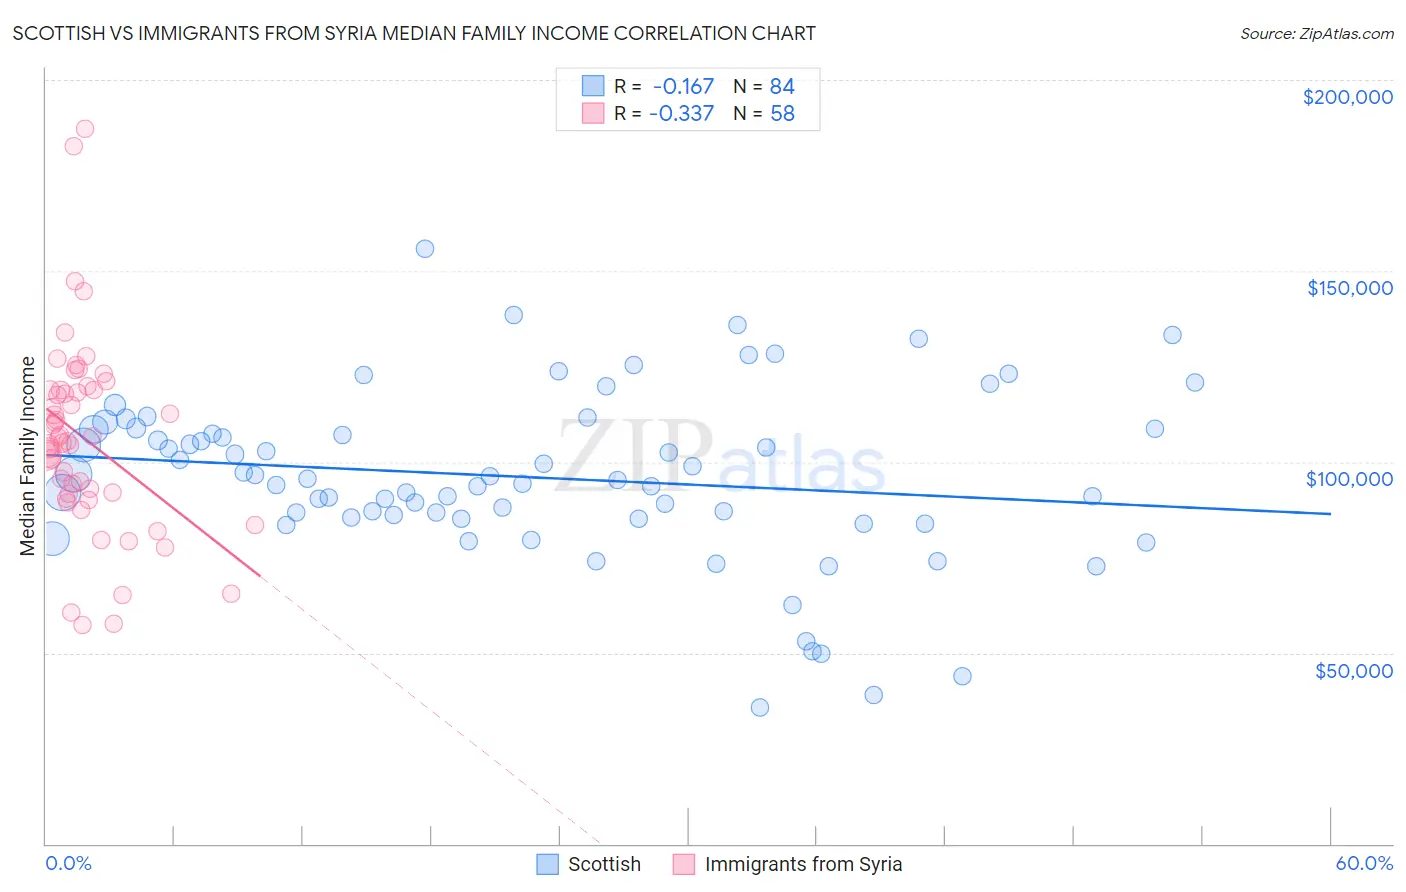
Scottish vs Immigrants from Syria Median Family Income Correlation Chart
The statistical analysis conducted on geographies consisting of 565,809,702 people shows a poor negative correlation between the proportion of Scottish and median family income in the United States with a correlation coefficient (R) of -0.167 and weighted average of $104,288. Similarly, the statistical analysis conducted on geographies consisting of 174,073,283 people shows a mild negative correlation between the proportion of Immigrants from Syria and median family income in the United States with a correlation coefficient (R) of -0.337 and weighted average of $106,118, a difference of 1.8%.
Median Family Income Correlation Summary
| Measurement | Scottish | Immigrants from Syria |
| Minimum | $35,833 | $57,198 |
| Maximum | $155,822 | $187,321 |
| Range | $119,989 | $130,123 |
| Mean | $95,991 | $106,113 |
| Median | $95,418 | $105,890 |
| Interquartile 25% (IQ1) | $85,332 | $91,647 |
| Interquartile 75% (IQ3) | $108,630 | $118,687 |
| Interquartile Range (IQR) | $23,298 | $27,040 |
| Standard Deviation (Sample) | $22,327 | $25,104 |
| Standard Deviation (Population) | $22,194 | $24,886 |
Demographics Similar to Scottish and Immigrants from Syria by Median Family Income
In terms of median family income, the demographic groups most similar to Scottish are Swiss ($104,396, a difference of 0.10%), Scandinavian ($104,410, a difference of 0.12%), Moroccan ($104,488, a difference of 0.19%), Basque ($104,760, a difference of 0.45%), and Native Hawaiian ($104,910, a difference of 0.60%). Similarly, the demographic groups most similar to Immigrants from Syria are Norwegian ($106,144, a difference of 0.020%), Slovene ($106,020, a difference of 0.090%), Tongan ($105,967, a difference of 0.14%), Immigrants from Morocco ($105,964, a difference of 0.15%), and Danish ($105,900, a difference of 0.21%).
| Demographics | Rating | Rank | Median Family Income |
| Norwegians | 85.5 /100 | #140 | Excellent $106,144 |
| Immigrants | Syria | 85.3 /100 | #141 | Excellent $106,118 |
| Slovenes | 84.7 /100 | #142 | Excellent $106,020 |
| Tongans | 84.3 /100 | #143 | Excellent $105,967 |
| Immigrants | Morocco | 84.3 /100 | #144 | Excellent $105,964 |
| Danes | 83.8 /100 | #145 | Excellent $105,900 |
| Czechs | 83.4 /100 | #146 | Excellent $105,839 |
| Immigrants | Chile | 82.1 /100 | #147 | Excellent $105,655 |
| Hungarians | 81.7 /100 | #148 | Excellent $105,609 |
| Immigrants | Germany | 80.9 /100 | #149 | Excellent $105,507 |
| Irish | 80.5 /100 | #150 | Excellent $105,453 |
| Peruvians | 80.4 /100 | #151 | Excellent $105,444 |
| Immigrants | Albania | 79.1 /100 | #152 | Good $105,285 |
| Slavs | 77.9 /100 | #153 | Good $105,144 |
| Immigrants | Nepal | 76.3 /100 | #154 | Good $104,966 |
| Native Hawaiians | 75.8 /100 | #155 | Good $104,910 |
| Basques | 74.4 /100 | #156 | Good $104,760 |
| Moroccans | 71.6 /100 | #157 | Good $104,488 |
| Scandinavians | 70.8 /100 | #158 | Good $104,410 |
| Swiss | 70.7 /100 | #159 | Good $104,396 |
| Scottish | 69.5 /100 | #160 | Good $104,288 |