Nigerian vs Immigrants from Canada Median Family Income
COMPARE
Nigerian
Immigrants from Canada
Median Family Income
Median Family Income Comparison
Nigerians
Immigrants from Canada
$97,522
MEDIAN FAMILY INCOME
6.7/ 100
METRIC RATING
215th/ 347
METRIC RANK
$112,374
MEDIAN FAMILY INCOME
99.3/ 100
METRIC RATING
78th/ 347
METRIC RANK
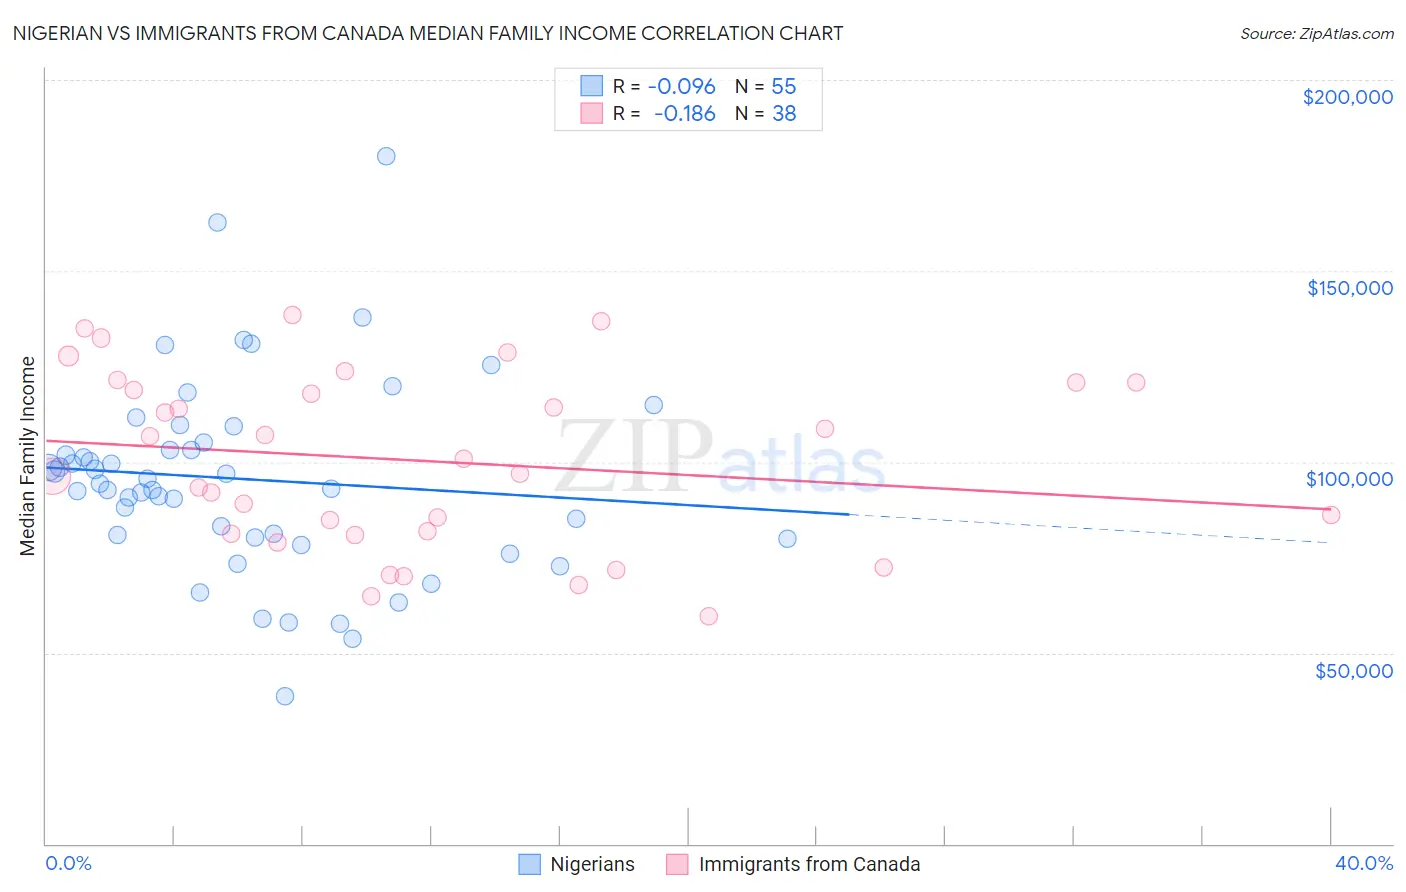
Nigerian vs Immigrants from Canada Median Family Income Correlation Chart
The statistical analysis conducted on geographies consisting of 332,335,879 people shows a slight negative correlation between the proportion of Nigerians and median family income in the United States with a correlation coefficient (R) of -0.096 and weighted average of $97,522. Similarly, the statistical analysis conducted on geographies consisting of 458,941,757 people shows a poor negative correlation between the proportion of Immigrants from Canada and median family income in the United States with a correlation coefficient (R) of -0.186 and weighted average of $112,374, a difference of 15.2%.
Median Family Income Correlation Summary
| Measurement | Nigerian | Immigrants from Canada |
| Minimum | $38,750 | $59,444 |
| Maximum | $179,905 | $138,302 |
| Range | $141,155 | $78,858 |
| Mean | $95,484 | $100,298 |
| Median | $94,247 | $98,848 |
| Interquartile 25% (IQ1) | $80,166 | $81,159 |
| Interquartile 75% (IQ3) | $105,230 | $120,729 |
| Interquartile Range (IQR) | $25,063 | $39,570 |
| Standard Deviation (Sample) | $25,645 | $23,025 |
| Standard Deviation (Population) | $25,411 | $22,720 |
Similar Demographics by Median Family Income
Demographics Similar to Nigerians by Median Family Income
In terms of median family income, the demographic groups most similar to Nigerians are Bermudan ($97,577, a difference of 0.060%), Immigrants from Armenia ($97,605, a difference of 0.090%), Immigrants from Bosnia and Herzegovina ($97,432, a difference of 0.090%), Panamanian ($97,683, a difference of 0.17%), and Immigrants from Sudan ($97,737, a difference of 0.22%).
| Demographics | Rating | Rank | Median Family Income |
| Immigrants | Uruguay | 9.2 /100 | #208 | Tragic $98,205 |
| Immigrants | Colombia | 8.7 /100 | #209 | Tragic $98,067 |
| Puget Sound Salish | 8.2 /100 | #210 | Tragic $97,958 |
| Immigrants | Sudan | 7.4 /100 | #211 | Tragic $97,737 |
| Panamanians | 7.2 /100 | #212 | Tragic $97,683 |
| Immigrants | Armenia | 7.0 /100 | #213 | Tragic $97,605 |
| Bermudans | 6.9 /100 | #214 | Tragic $97,577 |
| Nigerians | 6.7 /100 | #215 | Tragic $97,522 |
| Immigrants | Bosnia and Herzegovina | 6.4 /100 | #216 | Tragic $97,432 |
| Japanese | 6.0 /100 | #217 | Tragic $97,288 |
| Immigrants | Cambodia | 5.8 /100 | #218 | Tragic $97,222 |
| Delaware | 5.1 /100 | #219 | Tragic $96,958 |
| Sudanese | 4.7 /100 | #220 | Tragic $96,783 |
| Immigrants | Ghana | 4.2 /100 | #221 | Tragic $96,544 |
| Immigrants | Nigeria | 4.0 /100 | #222 | Tragic $96,439 |
Demographics Similar to Immigrants from Canada by Median Family Income
In terms of median family income, the demographic groups most similar to Immigrants from Canada are Italian ($112,372, a difference of 0.0%), Immigrants from Croatia ($112,323, a difference of 0.050%), Immigrants from Eastern Europe ($112,527, a difference of 0.14%), Immigrants from North America ($112,151, a difference of 0.20%), and Argentinean ($112,665, a difference of 0.26%).
| Demographics | Rating | Rank | Median Family Income |
| South Africans | 99.5 /100 | #71 | Exceptional $113,229 |
| Afghans | 99.5 /100 | #72 | Exceptional $112,971 |
| Laotians | 99.5 /100 | #73 | Exceptional $112,859 |
| Immigrants | Italy | 99.4 /100 | #74 | Exceptional $112,848 |
| Immigrants | Western Europe | 99.4 /100 | #75 | Exceptional $112,688 |
| Argentineans | 99.4 /100 | #76 | Exceptional $112,665 |
| Immigrants | Eastern Europe | 99.4 /100 | #77 | Exceptional $112,527 |
| Immigrants | Canada | 99.3 /100 | #78 | Exceptional $112,374 |
| Italians | 99.3 /100 | #79 | Exceptional $112,372 |
| Immigrants | Croatia | 99.3 /100 | #80 | Exceptional $112,323 |
| Immigrants | North America | 99.2 /100 | #81 | Exceptional $112,151 |
| Immigrants | England | 99.2 /100 | #82 | Exceptional $112,038 |
| Immigrants | Egypt | 99.0 /100 | #83 | Exceptional $111,689 |
| Immigrants | Hungary | 98.8 /100 | #84 | Exceptional $111,378 |
| Croatians | 98.8 /100 | #85 | Exceptional $111,370 |