Nigerian vs Immigrants from Philippines Median Family Income
COMPARE
Nigerian
Immigrants from Philippines
Median Family Income
Median Family Income Comparison
Nigerians
Immigrants from Philippines
$97,522
MEDIAN FAMILY INCOME
6.7/ 100
METRIC RATING
215th/ 347
METRIC RANK
$108,288
MEDIAN FAMILY INCOME
94.6/ 100
METRIC RATING
117th/ 347
METRIC RANK
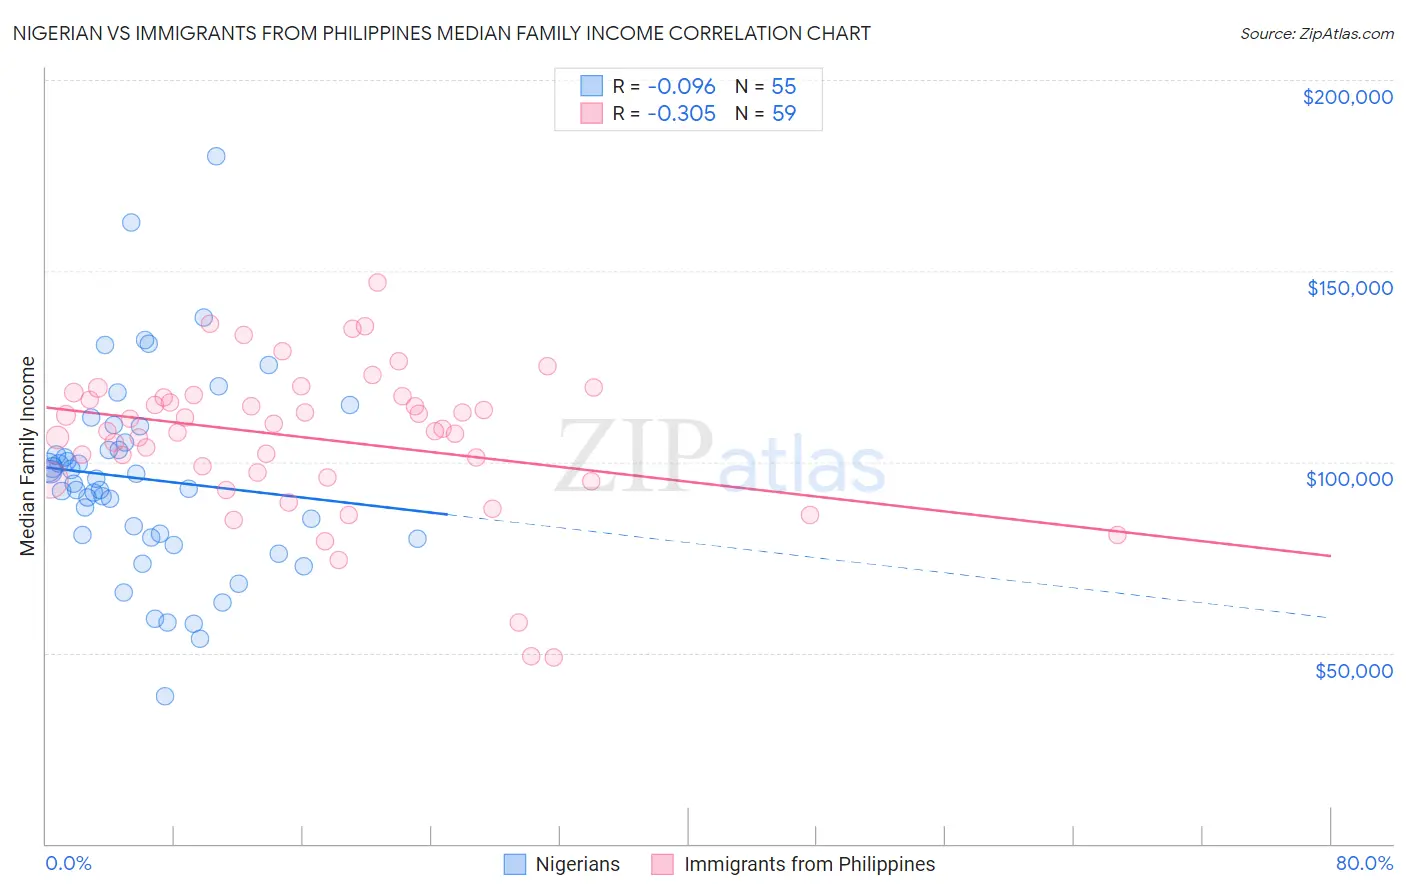
Nigerian vs Immigrants from Philippines Median Family Income Correlation Chart
The statistical analysis conducted on geographies consisting of 332,335,879 people shows a slight negative correlation between the proportion of Nigerians and median family income in the United States with a correlation coefficient (R) of -0.096 and weighted average of $97,522. Similarly, the statistical analysis conducted on geographies consisting of 470,858,648 people shows a mild negative correlation between the proportion of Immigrants from Philippines and median family income in the United States with a correlation coefficient (R) of -0.305 and weighted average of $108,288, a difference of 11.0%.
Median Family Income Correlation Summary
| Measurement | Nigerian | Immigrants from Philippines |
| Minimum | $38,750 | $48,750 |
| Maximum | $179,905 | $146,906 |
| Range | $141,155 | $98,156 |
| Mean | $95,484 | $106,076 |
| Median | $94,247 | $108,731 |
| Interquartile 25% (IQ1) | $80,166 | $96,071 |
| Interquartile 75% (IQ3) | $105,230 | $117,321 |
| Interquartile Range (IQR) | $25,063 | $21,250 |
| Standard Deviation (Sample) | $25,645 | $19,555 |
| Standard Deviation (Population) | $25,411 | $19,389 |
Similar Demographics by Median Family Income
Demographics Similar to Nigerians by Median Family Income
In terms of median family income, the demographic groups most similar to Nigerians are Bermudan ($97,577, a difference of 0.060%), Immigrants from Armenia ($97,605, a difference of 0.090%), Immigrants from Bosnia and Herzegovina ($97,432, a difference of 0.090%), Panamanian ($97,683, a difference of 0.17%), and Immigrants from Sudan ($97,737, a difference of 0.22%).
| Demographics | Rating | Rank | Median Family Income |
| Immigrants | Uruguay | 9.2 /100 | #208 | Tragic $98,205 |
| Immigrants | Colombia | 8.7 /100 | #209 | Tragic $98,067 |
| Puget Sound Salish | 8.2 /100 | #210 | Tragic $97,958 |
| Immigrants | Sudan | 7.4 /100 | #211 | Tragic $97,737 |
| Panamanians | 7.2 /100 | #212 | Tragic $97,683 |
| Immigrants | Armenia | 7.0 /100 | #213 | Tragic $97,605 |
| Bermudans | 6.9 /100 | #214 | Tragic $97,577 |
| Nigerians | 6.7 /100 | #215 | Tragic $97,522 |
| Immigrants | Bosnia and Herzegovina | 6.4 /100 | #216 | Tragic $97,432 |
| Japanese | 6.0 /100 | #217 | Tragic $97,288 |
| Immigrants | Cambodia | 5.8 /100 | #218 | Tragic $97,222 |
| Delaware | 5.1 /100 | #219 | Tragic $96,958 |
| Sudanese | 4.7 /100 | #220 | Tragic $96,783 |
| Immigrants | Ghana | 4.2 /100 | #221 | Tragic $96,544 |
| Immigrants | Nigeria | 4.0 /100 | #222 | Tragic $96,439 |
Demographics Similar to Immigrants from Philippines by Median Family Income
In terms of median family income, the demographic groups most similar to Immigrants from Philippines are Ethiopian ($108,251, a difference of 0.030%), Sri Lankan ($108,234, a difference of 0.050%), Immigrants from Northern Africa ($108,161, a difference of 0.12%), Chilean ($108,429, a difference of 0.13%), and European ($108,099, a difference of 0.18%).
| Demographics | Rating | Rank | Median Family Income |
| British | 95.6 /100 | #110 | Exceptional $108,705 |
| Immigrants | Western Asia | 95.6 /100 | #111 | Exceptional $108,691 |
| Immigrants | Poland | 95.3 /100 | #112 | Exceptional $108,570 |
| Immigrants | Saudi Arabia | 95.2 /100 | #113 | Exceptional $108,544 |
| Poles | 95.2 /100 | #114 | Exceptional $108,507 |
| Swedes | 95.1 /100 | #115 | Exceptional $108,499 |
| Chileans | 95.0 /100 | #116 | Exceptional $108,429 |
| Immigrants | Philippines | 94.6 /100 | #117 | Exceptional $108,288 |
| Ethiopians | 94.5 /100 | #118 | Exceptional $108,251 |
| Sri Lankans | 94.5 /100 | #119 | Exceptional $108,234 |
| Immigrants | Northern Africa | 94.3 /100 | #120 | Exceptional $108,161 |
| Europeans | 94.1 /100 | #121 | Exceptional $108,099 |
| Immigrants | Jordan | 92.9 /100 | #122 | Exceptional $107,715 |
| Carpatho Rusyns | 92.2 /100 | #123 | Exceptional $107,502 |
| Pakistanis | 91.7 /100 | #124 | Exceptional $107,390 |