Nigerian vs Immigrants from Israel Median Family Income
COMPARE
Nigerian
Immigrants from Israel
Median Family Income
Median Family Income Comparison
Nigerians
Immigrants from Israel
$97,522
MEDIAN FAMILY INCOME
6.7/ 100
METRIC RATING
215th/ 347
METRIC RANK
$127,430
MEDIAN FAMILY INCOME
100.0/ 100
METRIC RATING
11th/ 347
METRIC RANK
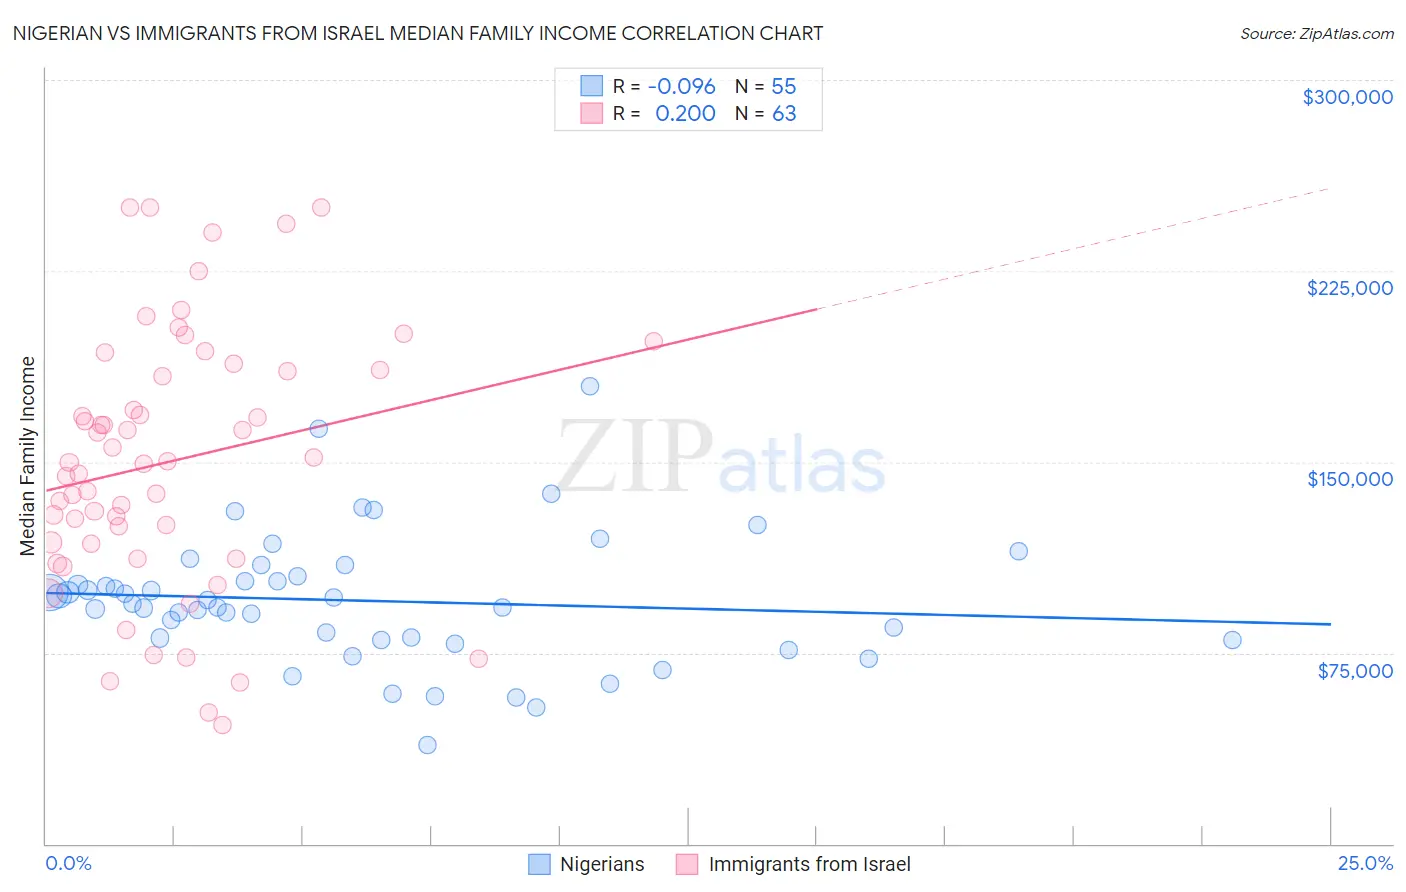
Nigerian vs Immigrants from Israel Median Family Income Correlation Chart
The statistical analysis conducted on geographies consisting of 332,335,879 people shows a slight negative correlation between the proportion of Nigerians and median family income in the United States with a correlation coefficient (R) of -0.096 and weighted average of $97,522. Similarly, the statistical analysis conducted on geographies consisting of 209,964,659 people shows a weak positive correlation between the proportion of Immigrants from Israel and median family income in the United States with a correlation coefficient (R) of 0.200 and weighted average of $127,430, a difference of 30.7%.
Median Family Income Correlation Summary
| Measurement | Nigerian | Immigrants from Israel |
| Minimum | $38,750 | $46,719 |
| Maximum | $179,905 | $250,001 |
| Range | $141,155 | $203,282 |
| Mean | $95,484 | $150,105 |
| Median | $94,247 | $149,830 |
| Interquartile 25% (IQ1) | $80,166 | $117,916 |
| Interquartile 75% (IQ3) | $105,230 | $185,912 |
| Interquartile Range (IQR) | $25,063 | $67,996 |
| Standard Deviation (Sample) | $25,645 | $50,555 |
| Standard Deviation (Population) | $25,411 | $50,152 |
Similar Demographics by Median Family Income
Demographics Similar to Nigerians by Median Family Income
In terms of median family income, the demographic groups most similar to Nigerians are Bermudan ($97,577, a difference of 0.060%), Immigrants from Armenia ($97,605, a difference of 0.090%), Immigrants from Bosnia and Herzegovina ($97,432, a difference of 0.090%), Panamanian ($97,683, a difference of 0.17%), and Immigrants from Sudan ($97,737, a difference of 0.22%).
| Demographics | Rating | Rank | Median Family Income |
| Immigrants | Uruguay | 9.2 /100 | #208 | Tragic $98,205 |
| Immigrants | Colombia | 8.7 /100 | #209 | Tragic $98,067 |
| Puget Sound Salish | 8.2 /100 | #210 | Tragic $97,958 |
| Immigrants | Sudan | 7.4 /100 | #211 | Tragic $97,737 |
| Panamanians | 7.2 /100 | #212 | Tragic $97,683 |
| Immigrants | Armenia | 7.0 /100 | #213 | Tragic $97,605 |
| Bermudans | 6.9 /100 | #214 | Tragic $97,577 |
| Nigerians | 6.7 /100 | #215 | Tragic $97,522 |
| Immigrants | Bosnia and Herzegovina | 6.4 /100 | #216 | Tragic $97,432 |
| Japanese | 6.0 /100 | #217 | Tragic $97,288 |
| Immigrants | Cambodia | 5.8 /100 | #218 | Tragic $97,222 |
| Delaware | 5.1 /100 | #219 | Tragic $96,958 |
| Sudanese | 4.7 /100 | #220 | Tragic $96,783 |
| Immigrants | Ghana | 4.2 /100 | #221 | Tragic $96,544 |
| Immigrants | Nigeria | 4.0 /100 | #222 | Tragic $96,439 |
Demographics Similar to Immigrants from Israel by Median Family Income
In terms of median family income, the demographic groups most similar to Immigrants from Israel are Immigrants from Ireland ($127,584, a difference of 0.12%), Cypriot ($127,064, a difference of 0.29%), Immigrants from Australia ($126,620, a difference of 0.64%), Immigrants from South Central Asia ($125,956, a difference of 1.2%), and Eastern European ($125,546, a difference of 1.5%).
| Demographics | Rating | Rank | Median Family Income |
| Immigrants | India | 100.0 /100 | #4 | Exceptional $134,028 |
| Iranians | 100.0 /100 | #5 | Exceptional $133,839 |
| Thais | 100.0 /100 | #6 | Exceptional $131,281 |
| Immigrants | Hong Kong | 100.0 /100 | #7 | Exceptional $131,067 |
| Immigrants | Iran | 100.0 /100 | #8 | Exceptional $130,894 |
| Okinawans | 100.0 /100 | #9 | Exceptional $129,979 |
| Immigrants | Ireland | 100.0 /100 | #10 | Exceptional $127,584 |
| Immigrants | Israel | 100.0 /100 | #11 | Exceptional $127,430 |
| Cypriots | 100.0 /100 | #12 | Exceptional $127,064 |
| Immigrants | Australia | 100.0 /100 | #13 | Exceptional $126,620 |
| Immigrants | South Central Asia | 100.0 /100 | #14 | Exceptional $125,956 |
| Eastern Europeans | 100.0 /100 | #15 | Exceptional $125,546 |
| Immigrants | China | 100.0 /100 | #16 | Exceptional $125,540 |
| Indians (Asian) | 100.0 /100 | #17 | Exceptional $125,312 |
| Immigrants | Eastern Asia | 100.0 /100 | #18 | Exceptional $125,150 |