Nigerian vs Immigrants from Sri Lanka Median Family Income
COMPARE
Nigerian
Immigrants from Sri Lanka
Median Family Income
Median Family Income Comparison
Nigerians
Immigrants from Sri Lanka
$97,522
MEDIAN FAMILY INCOME
6.7/ 100
METRIC RATING
215th/ 347
METRIC RANK
$120,263
MEDIAN FAMILY INCOME
100.0/ 100
METRIC RATING
30th/ 347
METRIC RANK
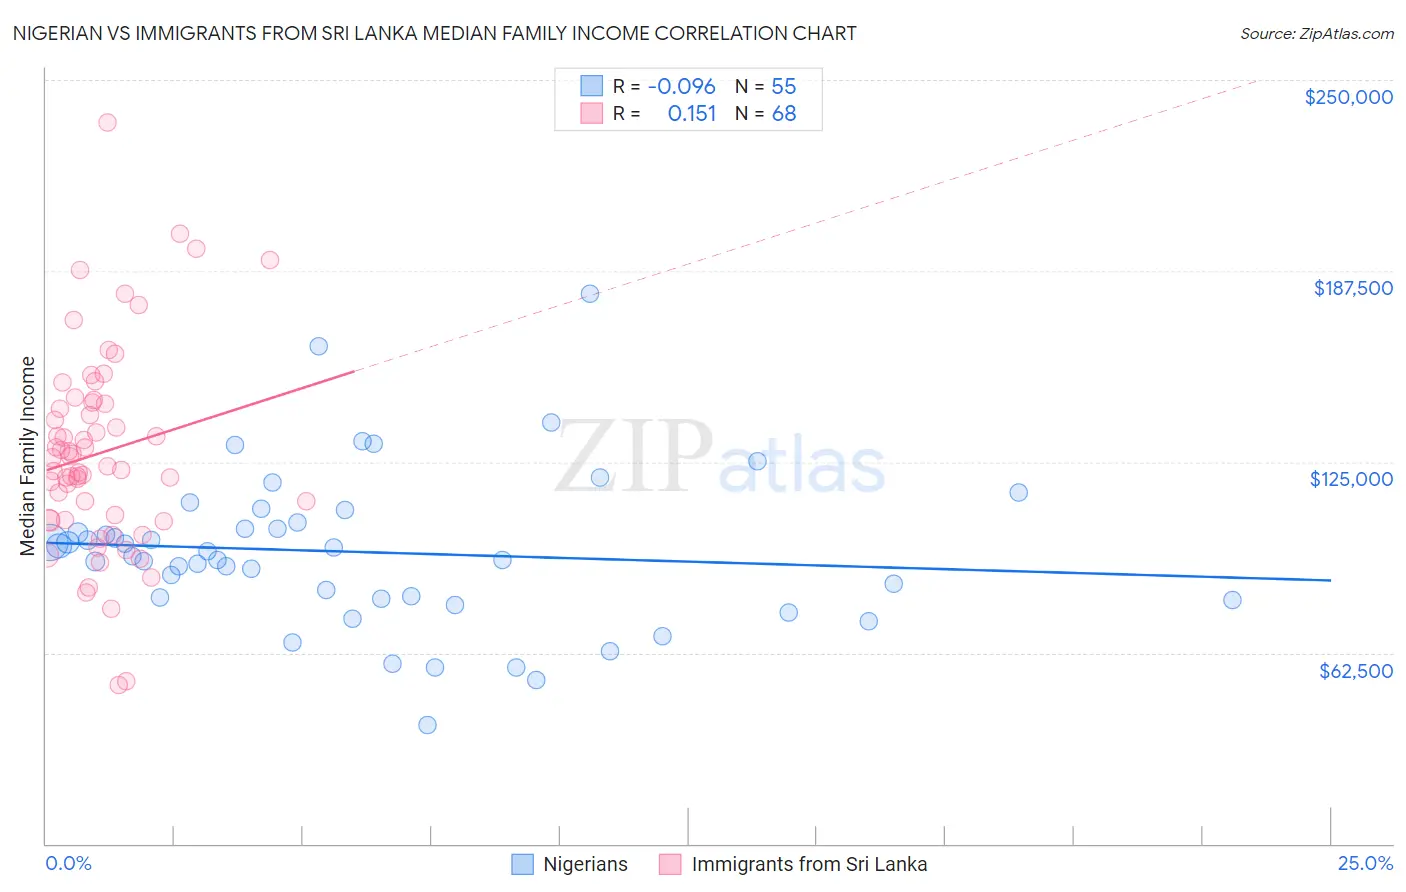
Nigerian vs Immigrants from Sri Lanka Median Family Income Correlation Chart
The statistical analysis conducted on geographies consisting of 332,335,879 people shows a slight negative correlation between the proportion of Nigerians and median family income in the United States with a correlation coefficient (R) of -0.096 and weighted average of $97,522. Similarly, the statistical analysis conducted on geographies consisting of 149,663,280 people shows a poor positive correlation between the proportion of Immigrants from Sri Lanka and median family income in the United States with a correlation coefficient (R) of 0.151 and weighted average of $120,263, a difference of 23.3%.
Median Family Income Correlation Summary
| Measurement | Nigerian | Immigrants from Sri Lanka |
| Minimum | $38,750 | $51,807 |
| Maximum | $179,905 | $236,102 |
| Range | $141,155 | $184,295 |
| Mean | $95,484 | $127,906 |
| Median | $94,247 | $125,011 |
| Interquartile 25% (IQ1) | $80,166 | $106,120 |
| Interquartile 75% (IQ3) | $105,230 | $144,308 |
| Interquartile Range (IQR) | $25,063 | $38,188 |
| Standard Deviation (Sample) | $25,645 | $33,114 |
| Standard Deviation (Population) | $25,411 | $32,870 |
Similar Demographics by Median Family Income
Demographics Similar to Nigerians by Median Family Income
In terms of median family income, the demographic groups most similar to Nigerians are Bermudan ($97,577, a difference of 0.060%), Immigrants from Armenia ($97,605, a difference of 0.090%), Immigrants from Bosnia and Herzegovina ($97,432, a difference of 0.090%), Panamanian ($97,683, a difference of 0.17%), and Immigrants from Sudan ($97,737, a difference of 0.22%).
| Demographics | Rating | Rank | Median Family Income |
| Immigrants | Uruguay | 9.2 /100 | #208 | Tragic $98,205 |
| Immigrants | Colombia | 8.7 /100 | #209 | Tragic $98,067 |
| Puget Sound Salish | 8.2 /100 | #210 | Tragic $97,958 |
| Immigrants | Sudan | 7.4 /100 | #211 | Tragic $97,737 |
| Panamanians | 7.2 /100 | #212 | Tragic $97,683 |
| Immigrants | Armenia | 7.0 /100 | #213 | Tragic $97,605 |
| Bermudans | 6.9 /100 | #214 | Tragic $97,577 |
| Nigerians | 6.7 /100 | #215 | Tragic $97,522 |
| Immigrants | Bosnia and Herzegovina | 6.4 /100 | #216 | Tragic $97,432 |
| Japanese | 6.0 /100 | #217 | Tragic $97,288 |
| Immigrants | Cambodia | 5.8 /100 | #218 | Tragic $97,222 |
| Delaware | 5.1 /100 | #219 | Tragic $96,958 |
| Sudanese | 4.7 /100 | #220 | Tragic $96,783 |
| Immigrants | Ghana | 4.2 /100 | #221 | Tragic $96,544 |
| Immigrants | Nigeria | 4.0 /100 | #222 | Tragic $96,439 |
Demographics Similar to Immigrants from Sri Lanka by Median Family Income
In terms of median family income, the demographic groups most similar to Immigrants from Sri Lanka are Latvian ($120,301, a difference of 0.030%), Immigrants from Denmark ($120,445, a difference of 0.15%), Immigrants from France ($120,076, a difference of 0.16%), Russian ($120,487, a difference of 0.19%), and Asian ($119,955, a difference of 0.26%).
| Demographics | Rating | Rank | Median Family Income |
| Immigrants | Japan | 100.0 /100 | #23 | Exceptional $122,764 |
| Immigrants | Northern Europe | 100.0 /100 | #24 | Exceptional $121,840 |
| Turks | 100.0 /100 | #25 | Exceptional $121,202 |
| Immigrants | Switzerland | 100.0 /100 | #26 | Exceptional $120,726 |
| Russians | 100.0 /100 | #27 | Exceptional $120,487 |
| Immigrants | Denmark | 100.0 /100 | #28 | Exceptional $120,445 |
| Latvians | 100.0 /100 | #29 | Exceptional $120,301 |
| Immigrants | Sri Lanka | 100.0 /100 | #30 | Exceptional $120,263 |
| Immigrants | France | 100.0 /100 | #31 | Exceptional $120,076 |
| Asians | 100.0 /100 | #32 | Exceptional $119,955 |
| Bhutanese | 100.0 /100 | #33 | Exceptional $119,800 |
| Bolivians | 100.0 /100 | #34 | Exceptional $119,479 |
| Soviet Union | 100.0 /100 | #35 | Exceptional $119,262 |
| Israelis | 100.0 /100 | #36 | Exceptional $118,577 |
| Australians | 100.0 /100 | #37 | Exceptional $118,440 |