Cree vs Immigrants from Syria Median Family Income
COMPARE
Cree
Immigrants from Syria
Median Family Income
Median Family Income Comparison
Cree
Immigrants from Syria
$90,882
MEDIAN FAMILY INCOME
0.2/ 100
METRIC RATING
268th/ 347
METRIC RANK
$106,118
MEDIAN FAMILY INCOME
85.3/ 100
METRIC RATING
141st/ 347
METRIC RANK
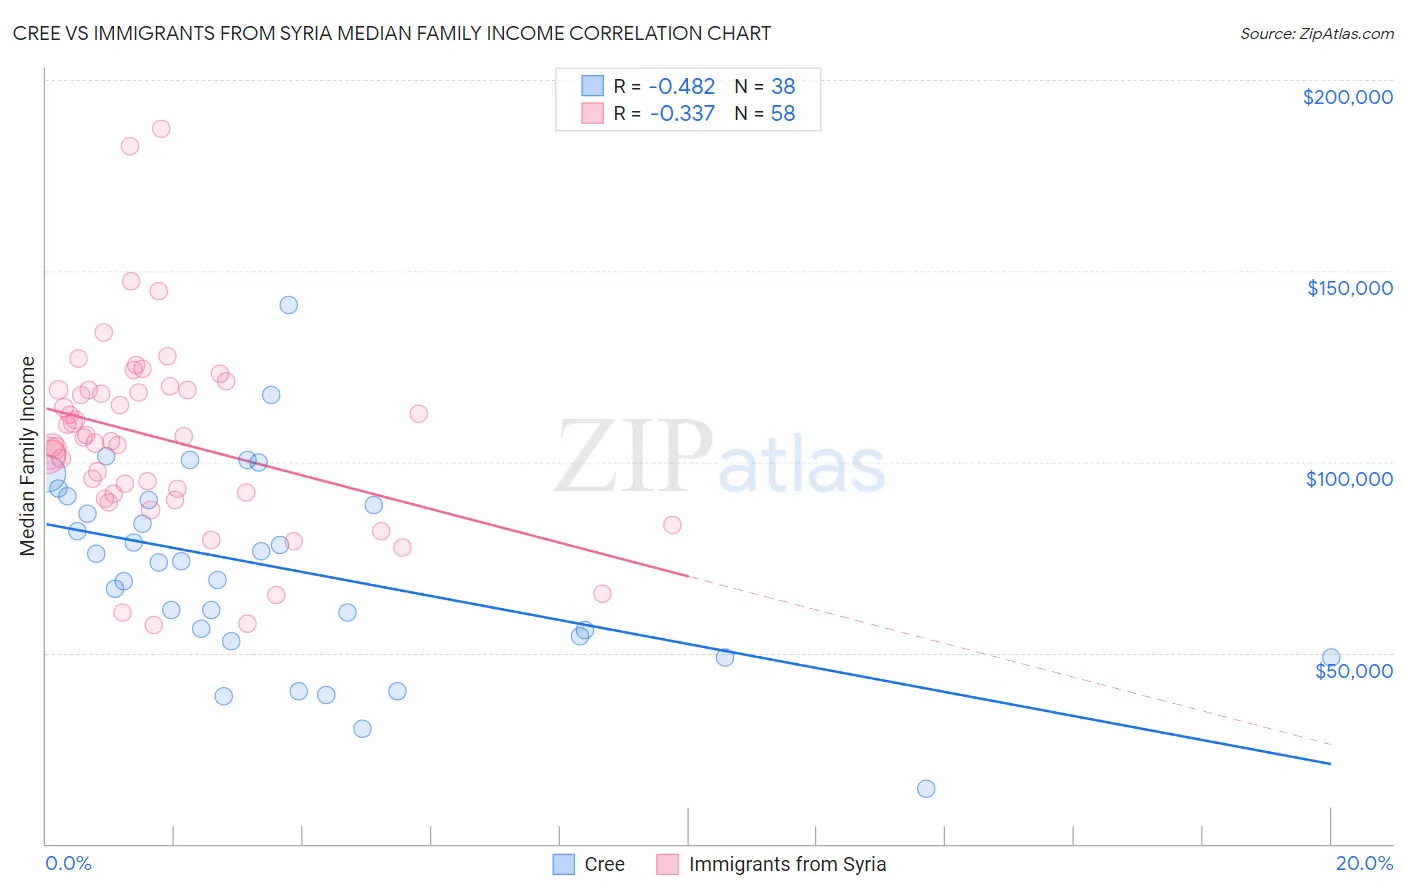
Cree vs Immigrants from Syria Median Family Income Correlation Chart
The statistical analysis conducted on geographies consisting of 76,200,070 people shows a moderate negative correlation between the proportion of Cree and median family income in the United States with a correlation coefficient (R) of -0.482 and weighted average of $90,882. Similarly, the statistical analysis conducted on geographies consisting of 174,073,283 people shows a mild negative correlation between the proportion of Immigrants from Syria and median family income in the United States with a correlation coefficient (R) of -0.337 and weighted average of $106,118, a difference of 16.8%.
Median Family Income Correlation Summary
| Measurement | Cree | Immigrants from Syria |
| Minimum | $14,519 | $57,198 |
| Maximum | $140,987 | $187,321 |
| Range | $126,468 | $130,123 |
| Mean | $71,996 | $106,113 |
| Median | $73,827 | $105,890 |
| Interquartile 25% (IQ1) | $54,375 | $91,647 |
| Interquartile 75% (IQ3) | $90,158 | $118,687 |
| Interquartile Range (IQR) | $35,783 | $27,040 |
| Standard Deviation (Sample) | $25,840 | $25,104 |
| Standard Deviation (Population) | $25,498 | $24,886 |
Similar Demographics by Median Family Income
Demographics Similar to Cree by Median Family Income
In terms of median family income, the demographic groups most similar to Cree are Belizean ($90,880, a difference of 0.0%), Mexican American Indian ($90,918, a difference of 0.040%), Central American ($91,087, a difference of 0.23%), Jamaican ($90,581, a difference of 0.33%), and Iroquois ($90,543, a difference of 0.37%).
| Demographics | Rating | Rank | Median Family Income |
| Inupiat | 0.4 /100 | #261 | Tragic $91,730 |
| Liberians | 0.4 /100 | #262 | Tragic $91,722 |
| Immigrants | West Indies | 0.3 /100 | #263 | Tragic $91,588 |
| Senegalese | 0.3 /100 | #264 | Tragic $91,475 |
| Hmong | 0.3 /100 | #265 | Tragic $91,296 |
| Central Americans | 0.3 /100 | #266 | Tragic $91,087 |
| Mexican American Indians | 0.2 /100 | #267 | Tragic $90,918 |
| Cree | 0.2 /100 | #268 | Tragic $90,882 |
| Belizeans | 0.2 /100 | #269 | Tragic $90,880 |
| Jamaicans | 0.2 /100 | #270 | Tragic $90,581 |
| Iroquois | 0.2 /100 | #271 | Tragic $90,543 |
| Immigrants | Liberia | 0.2 /100 | #272 | Tragic $90,450 |
| Immigrants | Micronesia | 0.2 /100 | #273 | Tragic $90,345 |
| Spanish Americans | 0.2 /100 | #274 | Tragic $90,322 |
| Immigrants | St. Vincent and the Grenadines | 0.2 /100 | #275 | Tragic $90,094 |
Demographics Similar to Immigrants from Syria by Median Family Income
In terms of median family income, the demographic groups most similar to Immigrants from Syria are Norwegian ($106,144, a difference of 0.020%), Immigrants from Vietnam ($106,186, a difference of 0.060%), Luxembourger ($106,183, a difference of 0.060%), Immigrants from Uganda ($106,188, a difference of 0.070%), and Slovene ($106,020, a difference of 0.090%).
| Demographics | Rating | Rank | Median Family Income |
| Immigrants | Oceania | 87.3 /100 | #134 | Excellent $106,453 |
| Portuguese | 86.3 /100 | #135 | Excellent $106,286 |
| Immigrants | South Eastern Asia | 86.1 /100 | #136 | Excellent $106,252 |
| Immigrants | Uganda | 85.7 /100 | #137 | Excellent $106,188 |
| Immigrants | Vietnam | 85.7 /100 | #138 | Excellent $106,186 |
| Luxembourgers | 85.7 /100 | #139 | Excellent $106,183 |
| Norwegians | 85.5 /100 | #140 | Excellent $106,144 |
| Immigrants | Syria | 85.3 /100 | #141 | Excellent $106,118 |
| Slovenes | 84.7 /100 | #142 | Excellent $106,020 |
| Tongans | 84.3 /100 | #143 | Excellent $105,967 |
| Immigrants | Morocco | 84.3 /100 | #144 | Excellent $105,964 |
| Danes | 83.8 /100 | #145 | Excellent $105,900 |
| Czechs | 83.4 /100 | #146 | Excellent $105,839 |
| Immigrants | Chile | 82.1 /100 | #147 | Excellent $105,655 |
| Hungarians | 81.7 /100 | #148 | Excellent $105,609 |