Nigerian vs Hungarian Median Family Income
COMPARE
Nigerian
Hungarian
Median Family Income
Median Family Income Comparison
Nigerians
Hungarians
$97,522
MEDIAN FAMILY INCOME
6.7/ 100
METRIC RATING
215th/ 347
METRIC RANK
$105,609
MEDIAN FAMILY INCOME
81.7/ 100
METRIC RATING
148th/ 347
METRIC RANK
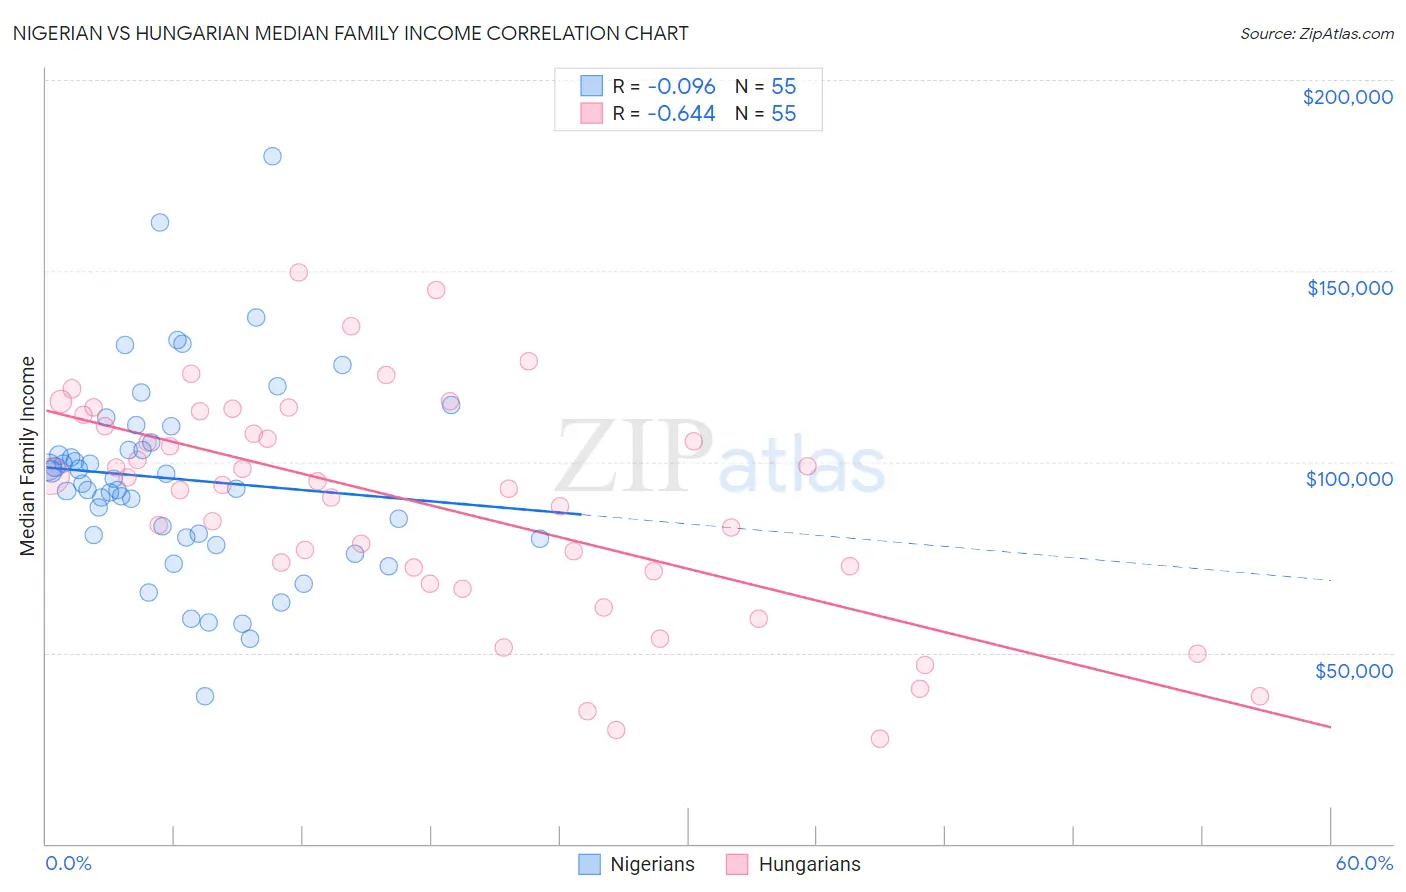
Nigerian vs Hungarian Median Family Income Correlation Chart
The statistical analysis conducted on geographies consisting of 332,335,879 people shows a slight negative correlation between the proportion of Nigerians and median family income in the United States with a correlation coefficient (R) of -0.096 and weighted average of $97,522. Similarly, the statistical analysis conducted on geographies consisting of 485,642,257 people shows a significant negative correlation between the proportion of Hungarians and median family income in the United States with a correlation coefficient (R) of -0.644 and weighted average of $105,609, a difference of 8.3%.
Median Family Income Correlation Summary
| Measurement | Nigerian | Hungarian |
| Minimum | $38,750 | $27,438 |
| Maximum | $179,905 | $149,519 |
| Range | $141,155 | $122,081 |
| Mean | $95,484 | $89,113 |
| Median | $94,247 | $94,101 |
| Interquartile 25% (IQ1) | $80,166 | $71,250 |
| Interquartile 75% (IQ3) | $105,230 | $112,341 |
| Interquartile Range (IQR) | $25,063 | $41,091 |
| Standard Deviation (Sample) | $25,645 | $29,093 |
| Standard Deviation (Population) | $25,411 | $28,828 |
Similar Demographics by Median Family Income
Demographics Similar to Nigerians by Median Family Income
In terms of median family income, the demographic groups most similar to Nigerians are Bermudan ($97,577, a difference of 0.060%), Immigrants from Armenia ($97,605, a difference of 0.090%), Immigrants from Bosnia and Herzegovina ($97,432, a difference of 0.090%), Panamanian ($97,683, a difference of 0.17%), and Immigrants from Sudan ($97,737, a difference of 0.22%).
| Demographics | Rating | Rank | Median Family Income |
| Immigrants | Uruguay | 9.2 /100 | #208 | Tragic $98,205 |
| Immigrants | Colombia | 8.7 /100 | #209 | Tragic $98,067 |
| Puget Sound Salish | 8.2 /100 | #210 | Tragic $97,958 |
| Immigrants | Sudan | 7.4 /100 | #211 | Tragic $97,737 |
| Panamanians | 7.2 /100 | #212 | Tragic $97,683 |
| Immigrants | Armenia | 7.0 /100 | #213 | Tragic $97,605 |
| Bermudans | 6.9 /100 | #214 | Tragic $97,577 |
| Nigerians | 6.7 /100 | #215 | Tragic $97,522 |
| Immigrants | Bosnia and Herzegovina | 6.4 /100 | #216 | Tragic $97,432 |
| Japanese | 6.0 /100 | #217 | Tragic $97,288 |
| Immigrants | Cambodia | 5.8 /100 | #218 | Tragic $97,222 |
| Delaware | 5.1 /100 | #219 | Tragic $96,958 |
| Sudanese | 4.7 /100 | #220 | Tragic $96,783 |
| Immigrants | Ghana | 4.2 /100 | #221 | Tragic $96,544 |
| Immigrants | Nigeria | 4.0 /100 | #222 | Tragic $96,439 |
Demographics Similar to Hungarians by Median Family Income
In terms of median family income, the demographic groups most similar to Hungarians are Immigrants from Chile ($105,655, a difference of 0.040%), Immigrants from Germany ($105,507, a difference of 0.10%), Irish ($105,453, a difference of 0.15%), Peruvian ($105,444, a difference of 0.16%), and Czech ($105,839, a difference of 0.22%).
| Demographics | Rating | Rank | Median Family Income |
| Immigrants | Syria | 85.3 /100 | #141 | Excellent $106,118 |
| Slovenes | 84.7 /100 | #142 | Excellent $106,020 |
| Tongans | 84.3 /100 | #143 | Excellent $105,967 |
| Immigrants | Morocco | 84.3 /100 | #144 | Excellent $105,964 |
| Danes | 83.8 /100 | #145 | Excellent $105,900 |
| Czechs | 83.4 /100 | #146 | Excellent $105,839 |
| Immigrants | Chile | 82.1 /100 | #147 | Excellent $105,655 |
| Hungarians | 81.7 /100 | #148 | Excellent $105,609 |
| Immigrants | Germany | 80.9 /100 | #149 | Excellent $105,507 |
| Irish | 80.5 /100 | #150 | Excellent $105,453 |
| Peruvians | 80.4 /100 | #151 | Excellent $105,444 |
| Immigrants | Albania | 79.1 /100 | #152 | Good $105,285 |
| Slavs | 77.9 /100 | #153 | Good $105,144 |
| Immigrants | Nepal | 76.3 /100 | #154 | Good $104,966 |
| Native Hawaiians | 75.8 /100 | #155 | Good $104,910 |