Immigrants from Zaire vs Immigrants from Philippines Median Family Income
COMPARE
Immigrants from Zaire
Immigrants from Philippines
Median Family Income
Median Family Income Comparison
Immigrants from Zaire
Immigrants from Philippines
$89,285
MEDIAN FAMILY INCOME
0.1/ 100
METRIC RATING
276th/ 347
METRIC RANK
$108,288
MEDIAN FAMILY INCOME
94.6/ 100
METRIC RATING
117th/ 347
METRIC RANK
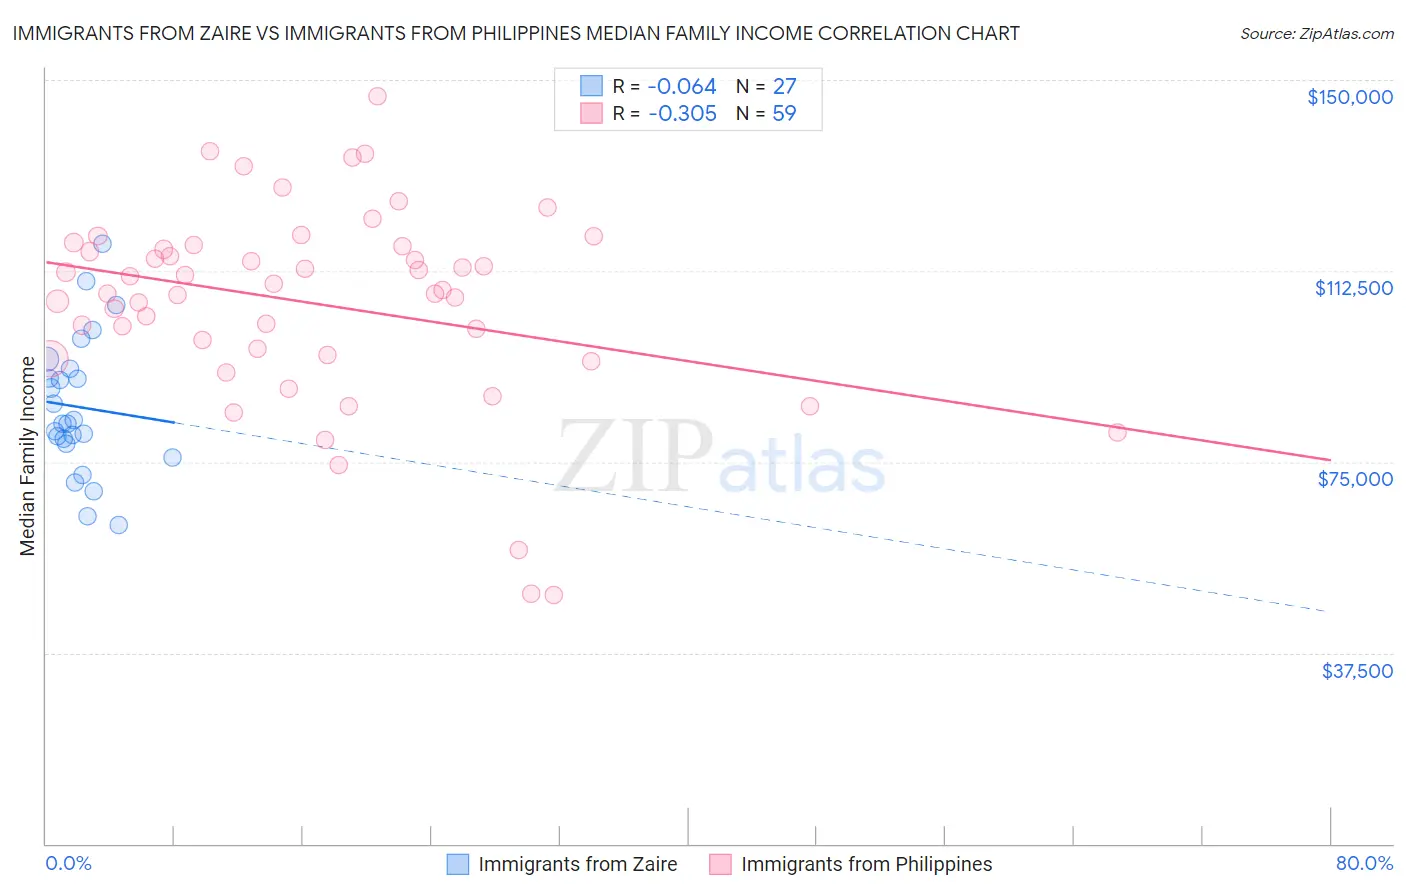
Immigrants from Zaire vs Immigrants from Philippines Median Family Income Correlation Chart
The statistical analysis conducted on geographies consisting of 107,241,539 people shows a slight negative correlation between the proportion of Immigrants from Zaire and median family income in the United States with a correlation coefficient (R) of -0.064 and weighted average of $89,285. Similarly, the statistical analysis conducted on geographies consisting of 470,858,648 people shows a mild negative correlation between the proportion of Immigrants from Philippines and median family income in the United States with a correlation coefficient (R) of -0.305 and weighted average of $108,288, a difference of 21.3%.
Median Family Income Correlation Summary
| Measurement | Immigrants from Zaire | Immigrants from Philippines |
| Minimum | $62,631 | $48,750 |
| Maximum | $117,948 | $146,906 |
| Range | $55,317 | $98,156 |
| Mean | $85,792 | $106,076 |
| Median | $82,545 | $108,731 |
| Interquartile 25% (IQ1) | $78,573 | $96,071 |
| Interquartile 75% (IQ3) | $93,272 | $117,321 |
| Interquartile Range (IQR) | $14,699 | $21,250 |
| Standard Deviation (Sample) | $13,444 | $19,555 |
| Standard Deviation (Population) | $13,193 | $19,389 |
Similar Demographics by Median Family Income
Demographics Similar to Immigrants from Zaire by Median Family Income
In terms of median family income, the demographic groups most similar to Immigrants from Zaire are Immigrants from Jamaica ($89,268, a difference of 0.020%), Immigrants from Grenada ($89,249, a difference of 0.040%), Immigrants from Belize ($89,197, a difference of 0.10%), British West Indian ($88,987, a difference of 0.33%), and Blackfeet ($88,717, a difference of 0.64%).
| Demographics | Rating | Rank | Median Family Income |
| Belizeans | 0.2 /100 | #269 | Tragic $90,880 |
| Jamaicans | 0.2 /100 | #270 | Tragic $90,581 |
| Iroquois | 0.2 /100 | #271 | Tragic $90,543 |
| Immigrants | Liberia | 0.2 /100 | #272 | Tragic $90,450 |
| Immigrants | Micronesia | 0.2 /100 | #273 | Tragic $90,345 |
| Spanish Americans | 0.2 /100 | #274 | Tragic $90,322 |
| Immigrants | St. Vincent and the Grenadines | 0.2 /100 | #275 | Tragic $90,094 |
| Immigrants | Zaire | 0.1 /100 | #276 | Tragic $89,285 |
| Immigrants | Jamaica | 0.1 /100 | #277 | Tragic $89,268 |
| Immigrants | Grenada | 0.1 /100 | #278 | Tragic $89,249 |
| Immigrants | Belize | 0.1 /100 | #279 | Tragic $89,197 |
| British West Indians | 0.1 /100 | #280 | Tragic $88,987 |
| Blackfeet | 0.1 /100 | #281 | Tragic $88,717 |
| Comanche | 0.1 /100 | #282 | Tragic $88,556 |
| Bangladeshis | 0.1 /100 | #283 | Tragic $88,358 |
Demographics Similar to Immigrants from Philippines by Median Family Income
In terms of median family income, the demographic groups most similar to Immigrants from Philippines are Ethiopian ($108,251, a difference of 0.030%), Sri Lankan ($108,234, a difference of 0.050%), Immigrants from Northern Africa ($108,161, a difference of 0.12%), Chilean ($108,429, a difference of 0.13%), and European ($108,099, a difference of 0.18%).
| Demographics | Rating | Rank | Median Family Income |
| British | 95.6 /100 | #110 | Exceptional $108,705 |
| Immigrants | Western Asia | 95.6 /100 | #111 | Exceptional $108,691 |
| Immigrants | Poland | 95.3 /100 | #112 | Exceptional $108,570 |
| Immigrants | Saudi Arabia | 95.2 /100 | #113 | Exceptional $108,544 |
| Poles | 95.2 /100 | #114 | Exceptional $108,507 |
| Swedes | 95.1 /100 | #115 | Exceptional $108,499 |
| Chileans | 95.0 /100 | #116 | Exceptional $108,429 |
| Immigrants | Philippines | 94.6 /100 | #117 | Exceptional $108,288 |
| Ethiopians | 94.5 /100 | #118 | Exceptional $108,251 |
| Sri Lankans | 94.5 /100 | #119 | Exceptional $108,234 |
| Immigrants | Northern Africa | 94.3 /100 | #120 | Exceptional $108,161 |
| Europeans | 94.1 /100 | #121 | Exceptional $108,099 |
| Immigrants | Jordan | 92.9 /100 | #122 | Exceptional $107,715 |
| Carpatho Rusyns | 92.2 /100 | #123 | Exceptional $107,502 |
| Pakistanis | 91.7 /100 | #124 | Exceptional $107,390 |