Crow vs Immigrants from Philippines Median Family Income
COMPARE
Crow
Immigrants from Philippines
Median Family Income
Median Family Income Comparison
Crow
Immigrants from Philippines
$76,605
MEDIAN FAMILY INCOME
0.0/ 100
METRIC RATING
342nd/ 347
METRIC RANK
$108,288
MEDIAN FAMILY INCOME
94.6/ 100
METRIC RATING
117th/ 347
METRIC RANK
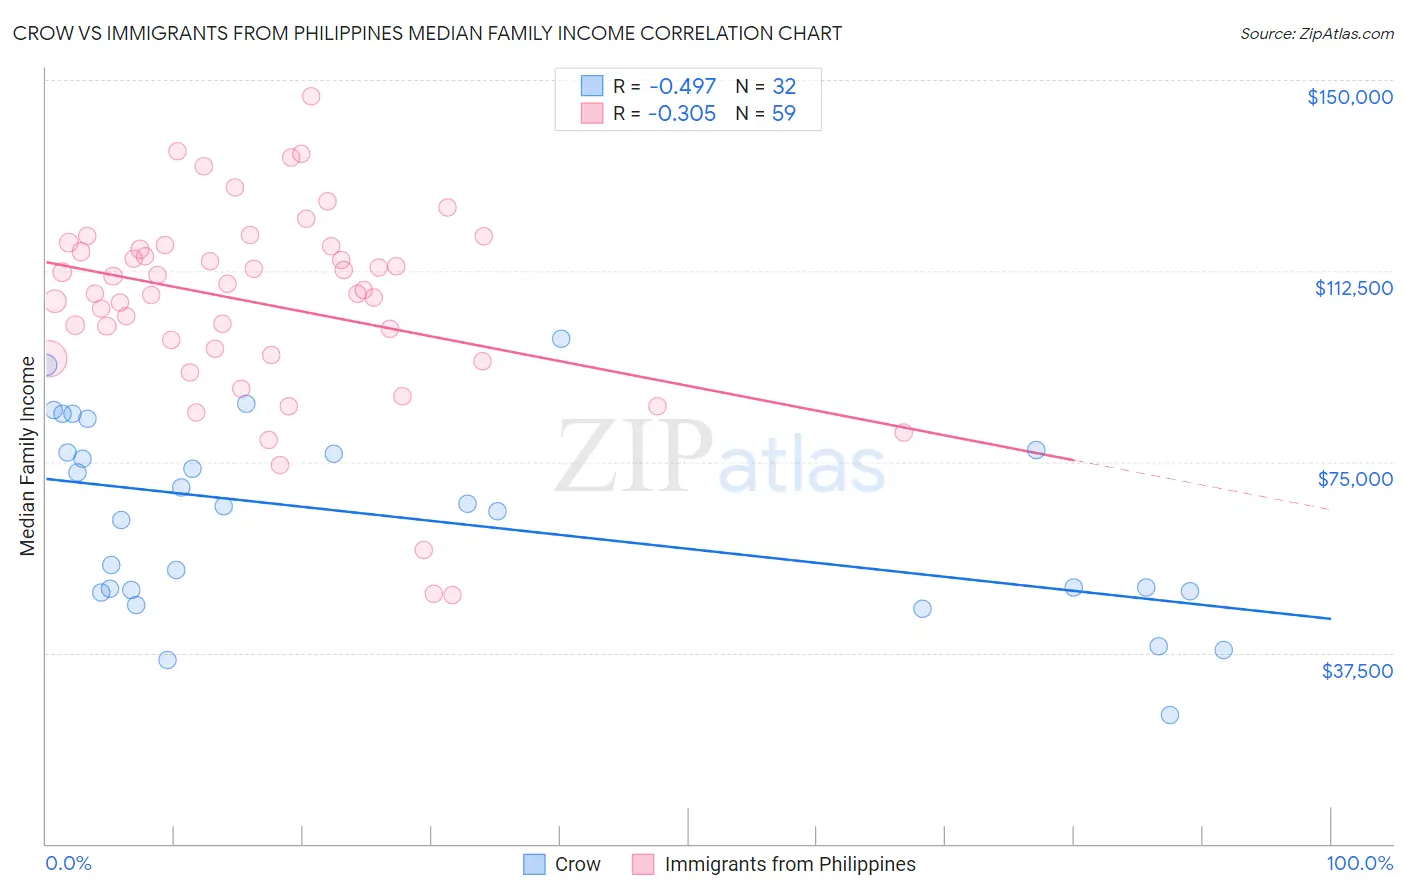
Crow vs Immigrants from Philippines Median Family Income Correlation Chart
The statistical analysis conducted on geographies consisting of 59,195,543 people shows a moderate negative correlation between the proportion of Crow and median family income in the United States with a correlation coefficient (R) of -0.497 and weighted average of $76,605. Similarly, the statistical analysis conducted on geographies consisting of 470,858,648 people shows a mild negative correlation between the proportion of Immigrants from Philippines and median family income in the United States with a correlation coefficient (R) of -0.305 and weighted average of $108,288, a difference of 41.4%.
Median Family Income Correlation Summary
| Measurement | Crow | Immigrants from Philippines |
| Minimum | $25,179 | $48,750 |
| Maximum | $99,219 | $146,906 |
| Range | $74,040 | $98,156 |
| Mean | $63,807 | $106,076 |
| Median | $65,747 | $108,731 |
| Interquartile 25% (IQ1) | $49,683 | $96,071 |
| Interquartile 75% (IQ3) | $77,098 | $117,321 |
| Interquartile Range (IQR) | $27,414 | $21,250 |
| Standard Deviation (Sample) | $18,632 | $19,555 |
| Standard Deviation (Population) | $18,339 | $19,389 |
Similar Demographics by Median Family Income
Demographics Similar to Crow by Median Family Income
In terms of median family income, the demographic groups most similar to Crow are Pueblo ($76,880, a difference of 0.36%), Houma ($76,188, a difference of 0.55%), Hopi ($77,188, a difference of 0.76%), Pima ($77,431, a difference of 1.1%), and Immigrants from Yemen ($77,457, a difference of 1.1%).
| Demographics | Rating | Rank | Median Family Income |
| Kiowa | 0.0 /100 | #333 | Tragic $80,885 |
| Menominee | 0.0 /100 | #334 | Tragic $79,563 |
| Yup'ik | 0.0 /100 | #335 | Tragic $79,290 |
| Immigrants | Cuba | 0.0 /100 | #336 | Tragic $78,249 |
| Yuman | 0.0 /100 | #337 | Tragic $78,055 |
| Immigrants | Yemen | 0.0 /100 | #338 | Tragic $77,457 |
| Pima | 0.0 /100 | #339 | Tragic $77,431 |
| Hopi | 0.0 /100 | #340 | Tragic $77,188 |
| Pueblo | 0.0 /100 | #341 | Tragic $76,880 |
| Crow | 0.0 /100 | #342 | Tragic $76,605 |
| Houma | 0.0 /100 | #343 | Tragic $76,188 |
| Tohono O'odham | 0.0 /100 | #344 | Tragic $72,193 |
| Navajo | 0.0 /100 | #345 | Tragic $70,989 |
| Puerto Ricans | 0.0 /100 | #346 | Tragic $70,423 |
| Lumbee | 0.0 /100 | #347 | Tragic $68,679 |
Demographics Similar to Immigrants from Philippines by Median Family Income
In terms of median family income, the demographic groups most similar to Immigrants from Philippines are Ethiopian ($108,251, a difference of 0.030%), Sri Lankan ($108,234, a difference of 0.050%), Immigrants from Northern Africa ($108,161, a difference of 0.12%), Chilean ($108,429, a difference of 0.13%), and European ($108,099, a difference of 0.18%).
| Demographics | Rating | Rank | Median Family Income |
| British | 95.6 /100 | #110 | Exceptional $108,705 |
| Immigrants | Western Asia | 95.6 /100 | #111 | Exceptional $108,691 |
| Immigrants | Poland | 95.3 /100 | #112 | Exceptional $108,570 |
| Immigrants | Saudi Arabia | 95.2 /100 | #113 | Exceptional $108,544 |
| Poles | 95.2 /100 | #114 | Exceptional $108,507 |
| Swedes | 95.1 /100 | #115 | Exceptional $108,499 |
| Chileans | 95.0 /100 | #116 | Exceptional $108,429 |
| Immigrants | Philippines | 94.6 /100 | #117 | Exceptional $108,288 |
| Ethiopians | 94.5 /100 | #118 | Exceptional $108,251 |
| Sri Lankans | 94.5 /100 | #119 | Exceptional $108,234 |
| Immigrants | Northern Africa | 94.3 /100 | #120 | Exceptional $108,161 |
| Europeans | 94.1 /100 | #121 | Exceptional $108,099 |
| Immigrants | Jordan | 92.9 /100 | #122 | Exceptional $107,715 |
| Carpatho Rusyns | 92.2 /100 | #123 | Exceptional $107,502 |
| Pakistanis | 91.7 /100 | #124 | Exceptional $107,390 |