Inupiat vs South American Indian Median Male Earnings
COMPARE
Inupiat
South American Indian
Median Male Earnings
Median Male Earnings Comparison
Inupiat
South American Indians
$47,281
MEDIAN MALE EARNINGS
0.1/ 100
METRIC RATING
296th/ 347
METRIC RANK
$54,508
MEDIAN MALE EARNINGS
50.4/ 100
METRIC RATING
173rd/ 347
METRIC RANK
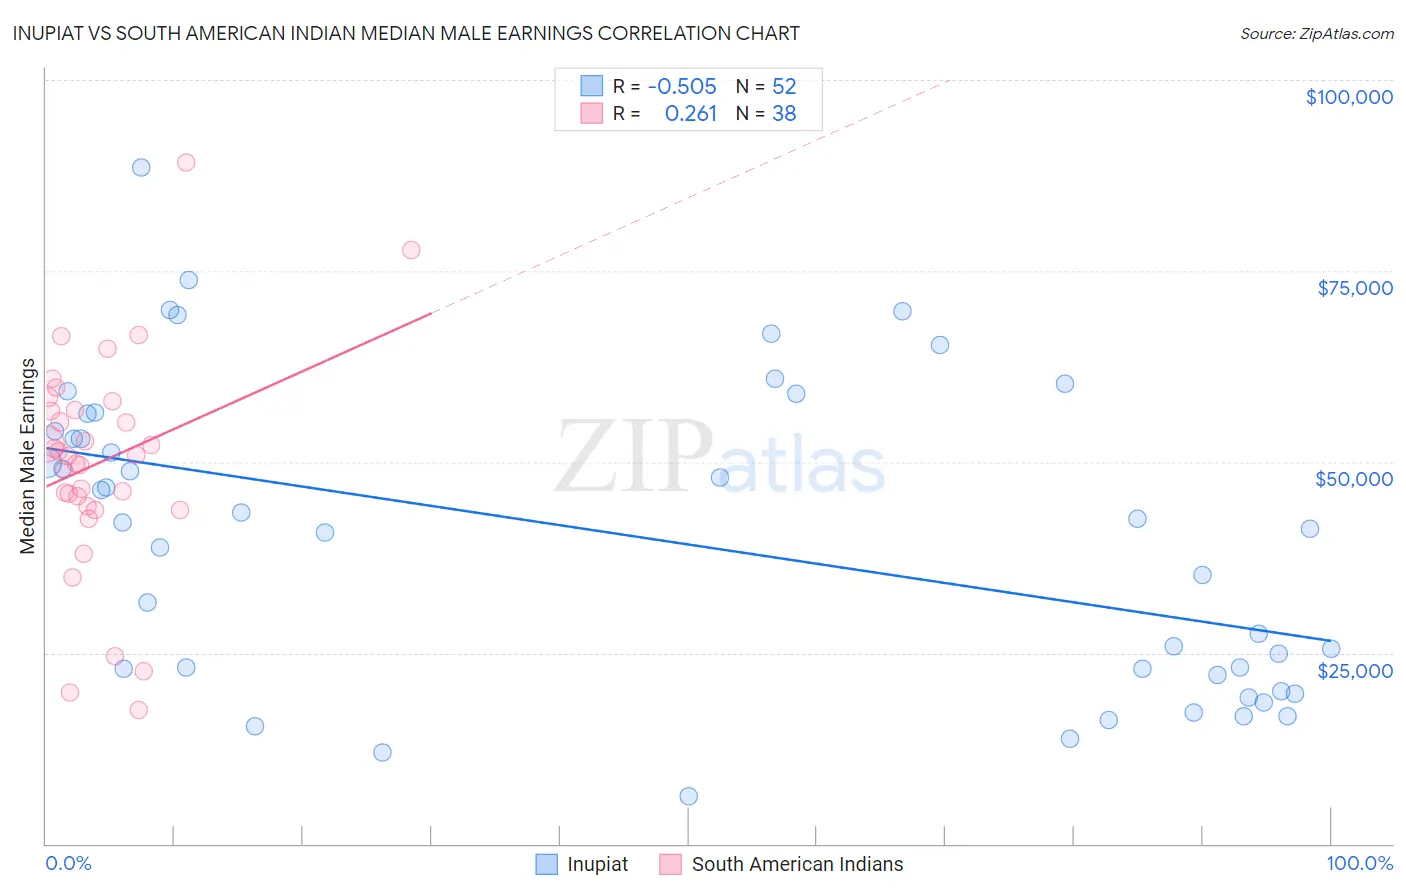
Inupiat vs South American Indian Median Male Earnings Correlation Chart
The statistical analysis conducted on geographies consisting of 96,323,006 people shows a substantial negative correlation between the proportion of Inupiat and median male earnings in the United States with a correlation coefficient (R) of -0.505 and weighted average of $47,281. Similarly, the statistical analysis conducted on geographies consisting of 164,558,880 people shows a weak positive correlation between the proportion of South American Indians and median male earnings in the United States with a correlation coefficient (R) of 0.261 and weighted average of $54,508, a difference of 15.3%.
Median Male Earnings Correlation Summary
| Measurement | Inupiat | South American Indian |
| Minimum | $6,250 | $17,560 |
| Maximum | $88,594 | $89,196 |
| Range | $82,344 | $71,636 |
| Mean | $40,024 | $49,938 |
| Median | $41,688 | $50,818 |
| Interquartile 25% (IQ1) | $22,499 | $44,221 |
| Interquartile 75% (IQ3) | $55,179 | $56,795 |
| Interquartile Range (IQR) | $32,680 | $12,575 |
| Standard Deviation (Sample) | $19,878 | $14,312 |
| Standard Deviation (Population) | $19,686 | $14,122 |
Similar Demographics by Median Male Earnings
Demographics Similar to Inupiat by Median Male Earnings
In terms of median male earnings, the demographic groups most similar to Inupiat are Dominican ($47,204, a difference of 0.16%), Immigrants from Micronesia ($47,177, a difference of 0.22%), Central American Indian ($47,433, a difference of 0.32%), Immigrants from Nicaragua ($47,482, a difference of 0.43%), and Immigrants from Zaire ($47,070, a difference of 0.45%).
| Demographics | Rating | Rank | Median Male Earnings |
| Chickasaw | 0.1 /100 | #289 | Tragic $47,832 |
| Immigrants | Belize | 0.1 /100 | #290 | Tragic $47,809 |
| Choctaw | 0.1 /100 | #291 | Tragic $47,729 |
| Immigrants | Dominica | 0.1 /100 | #292 | Tragic $47,651 |
| Indonesians | 0.1 /100 | #293 | Tragic $47,503 |
| Immigrants | Nicaragua | 0.1 /100 | #294 | Tragic $47,482 |
| Central American Indians | 0.1 /100 | #295 | Tragic $47,433 |
| Inupiat | 0.1 /100 | #296 | Tragic $47,281 |
| Dominicans | 0.1 /100 | #297 | Tragic $47,204 |
| Immigrants | Micronesia | 0.1 /100 | #298 | Tragic $47,177 |
| Immigrants | Zaire | 0.1 /100 | #299 | Tragic $47,070 |
| U.S. Virgin Islanders | 0.1 /100 | #300 | Tragic $47,066 |
| Immigrants | Latin America | 0.1 /100 | #301 | Tragic $46,941 |
| Seminole | 0.1 /100 | #302 | Tragic $46,783 |
| Yaqui | 0.1 /100 | #303 | Tragic $46,777 |
Demographics Similar to South American Indians by Median Male Earnings
In terms of median male earnings, the demographic groups most similar to South American Indians are South American ($54,492, a difference of 0.030%), Dutch ($54,410, a difference of 0.18%), Spaniard ($54,401, a difference of 0.20%), Welsh ($54,647, a difference of 0.25%), and Immigrants from Peru ($54,695, a difference of 0.34%).
| Demographics | Rating | Rank | Median Male Earnings |
| Germans | 61.6 /100 | #166 | Good $54,974 |
| Immigrants | Fiji | 61.2 /100 | #167 | Good $54,958 |
| Immigrants | Vietnam | 60.2 /100 | #168 | Good $54,913 |
| French Canadians | 55.6 /100 | #169 | Average $54,722 |
| Finns | 55.6 /100 | #170 | Average $54,721 |
| Immigrants | Peru | 54.9 /100 | #171 | Average $54,695 |
| Welsh | 53.8 /100 | #172 | Average $54,647 |
| South American Indians | 50.4 /100 | #173 | Average $54,508 |
| South Americans | 50.0 /100 | #174 | Average $54,492 |
| Dutch | 48.0 /100 | #175 | Average $54,410 |
| Spaniards | 47.8 /100 | #176 | Average $54,401 |
| Costa Ricans | 44.8 /100 | #177 | Average $54,279 |
| Sierra Leoneans | 44.8 /100 | #178 | Average $54,279 |
| Celtics | 43.9 /100 | #179 | Average $54,242 |
| Iraqis | 42.5 /100 | #180 | Average $54,182 |