Inupiat vs Alaska Native Median Male Earnings
COMPARE
Inupiat
Alaska Native
Median Male Earnings
Median Male Earnings Comparison
Inupiat
Alaska Natives
$47,281
MEDIAN MALE EARNINGS
0.1/ 100
METRIC RATING
296th/ 347
METRIC RANK
$49,711
MEDIAN MALE EARNINGS
0.9/ 100
METRIC RATING
256th/ 347
METRIC RANK
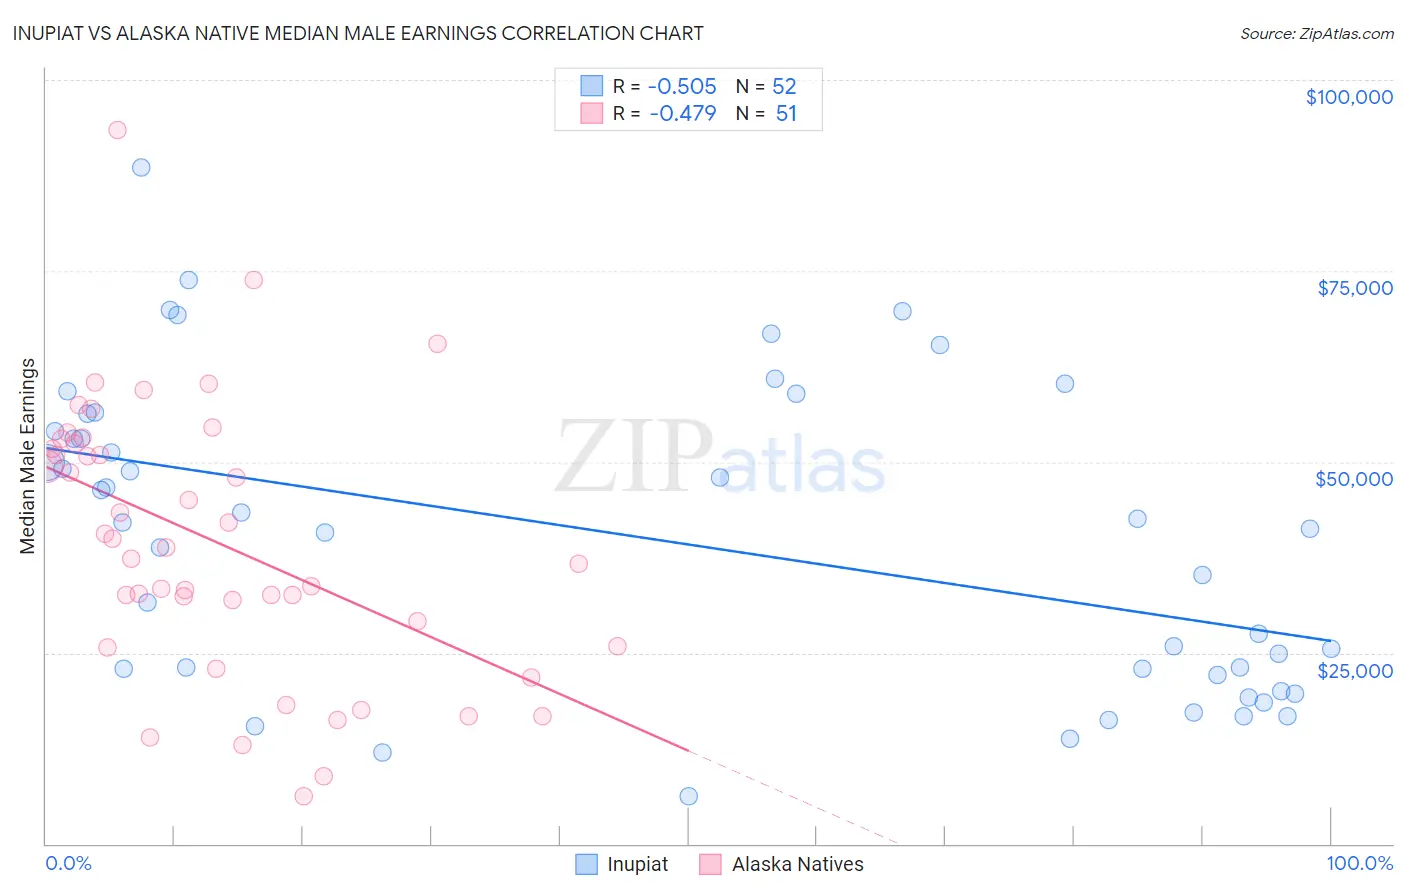
Inupiat vs Alaska Native Median Male Earnings Correlation Chart
The statistical analysis conducted on geographies consisting of 96,323,006 people shows a substantial negative correlation between the proportion of Inupiat and median male earnings in the United States with a correlation coefficient (R) of -0.505 and weighted average of $47,281. Similarly, the statistical analysis conducted on geographies consisting of 76,751,910 people shows a moderate negative correlation between the proportion of Alaska Natives and median male earnings in the United States with a correlation coefficient (R) of -0.479 and weighted average of $49,711, a difference of 5.1%.
Median Male Earnings Correlation Summary
| Measurement | Inupiat | Alaska Native |
| Minimum | $6,250 | $6,250 |
| Maximum | $88,594 | $93,451 |
| Range | $82,344 | $87,201 |
| Mean | $40,024 | $39,521 |
| Median | $41,688 | $38,750 |
| Interquartile 25% (IQ1) | $22,499 | $25,833 |
| Interquartile 75% (IQ3) | $55,179 | $52,440 |
| Interquartile Range (IQR) | $32,680 | $26,607 |
| Standard Deviation (Sample) | $19,878 | $17,827 |
| Standard Deviation (Population) | $19,686 | $17,652 |
Similar Demographics by Median Male Earnings
Demographics Similar to Inupiat by Median Male Earnings
In terms of median male earnings, the demographic groups most similar to Inupiat are Dominican ($47,204, a difference of 0.16%), Immigrants from Micronesia ($47,177, a difference of 0.22%), Central American Indian ($47,433, a difference of 0.32%), Immigrants from Nicaragua ($47,482, a difference of 0.43%), and Immigrants from Zaire ($47,070, a difference of 0.45%).
| Demographics | Rating | Rank | Median Male Earnings |
| Chickasaw | 0.1 /100 | #289 | Tragic $47,832 |
| Immigrants | Belize | 0.1 /100 | #290 | Tragic $47,809 |
| Choctaw | 0.1 /100 | #291 | Tragic $47,729 |
| Immigrants | Dominica | 0.1 /100 | #292 | Tragic $47,651 |
| Indonesians | 0.1 /100 | #293 | Tragic $47,503 |
| Immigrants | Nicaragua | 0.1 /100 | #294 | Tragic $47,482 |
| Central American Indians | 0.1 /100 | #295 | Tragic $47,433 |
| Inupiat | 0.1 /100 | #296 | Tragic $47,281 |
| Dominicans | 0.1 /100 | #297 | Tragic $47,204 |
| Immigrants | Micronesia | 0.1 /100 | #298 | Tragic $47,177 |
| Immigrants | Zaire | 0.1 /100 | #299 | Tragic $47,070 |
| U.S. Virgin Islanders | 0.1 /100 | #300 | Tragic $47,066 |
| Immigrants | Latin America | 0.1 /100 | #301 | Tragic $46,941 |
| Seminole | 0.1 /100 | #302 | Tragic $46,783 |
| Yaqui | 0.1 /100 | #303 | Tragic $46,777 |
Demographics Similar to Alaska Natives by Median Male Earnings
In terms of median male earnings, the demographic groups most similar to Alaska Natives are Alaskan Athabascan ($49,748, a difference of 0.070%), Senegalese ($49,774, a difference of 0.13%), British West Indian ($49,636, a difference of 0.15%), German Russian ($49,924, a difference of 0.43%), and Cree ($49,497, a difference of 0.43%).
| Demographics | Rating | Rank | Median Male Earnings |
| Immigrants | Burma/Myanmar | 1.6 /100 | #249 | Tragic $50,298 |
| Osage | 1.6 /100 | #250 | Tragic $50,292 |
| Immigrants | Grenada | 1.6 /100 | #251 | Tragic $50,279 |
| Immigrants | Cabo Verde | 1.2 /100 | #252 | Tragic $50,009 |
| German Russians | 1.1 /100 | #253 | Tragic $49,924 |
| Senegalese | 1.0 /100 | #254 | Tragic $49,774 |
| Alaskan Athabascans | 0.9 /100 | #255 | Tragic $49,748 |
| Alaska Natives | 0.9 /100 | #256 | Tragic $49,711 |
| British West Indians | 0.8 /100 | #257 | Tragic $49,636 |
| Cree | 0.7 /100 | #258 | Tragic $49,497 |
| Nepalese | 0.7 /100 | #259 | Tragic $49,458 |
| Iroquois | 0.7 /100 | #260 | Tragic $49,374 |
| Liberians | 0.6 /100 | #261 | Tragic $49,318 |
| Immigrants | West Indies | 0.6 /100 | #262 | Tragic $49,271 |
| Nicaraguans | 0.6 /100 | #263 | Tragic $49,215 |