Bulgarian vs South American Indian Median Male Earnings
COMPARE
Bulgarian
South American Indian
Median Male Earnings
Median Male Earnings Comparison
Bulgarians
South American Indians
$62,378
MEDIAN MALE EARNINGS
100.0/ 100
METRIC RATING
45th/ 347
METRIC RANK
$54,508
MEDIAN MALE EARNINGS
50.4/ 100
METRIC RATING
173rd/ 347
METRIC RANK
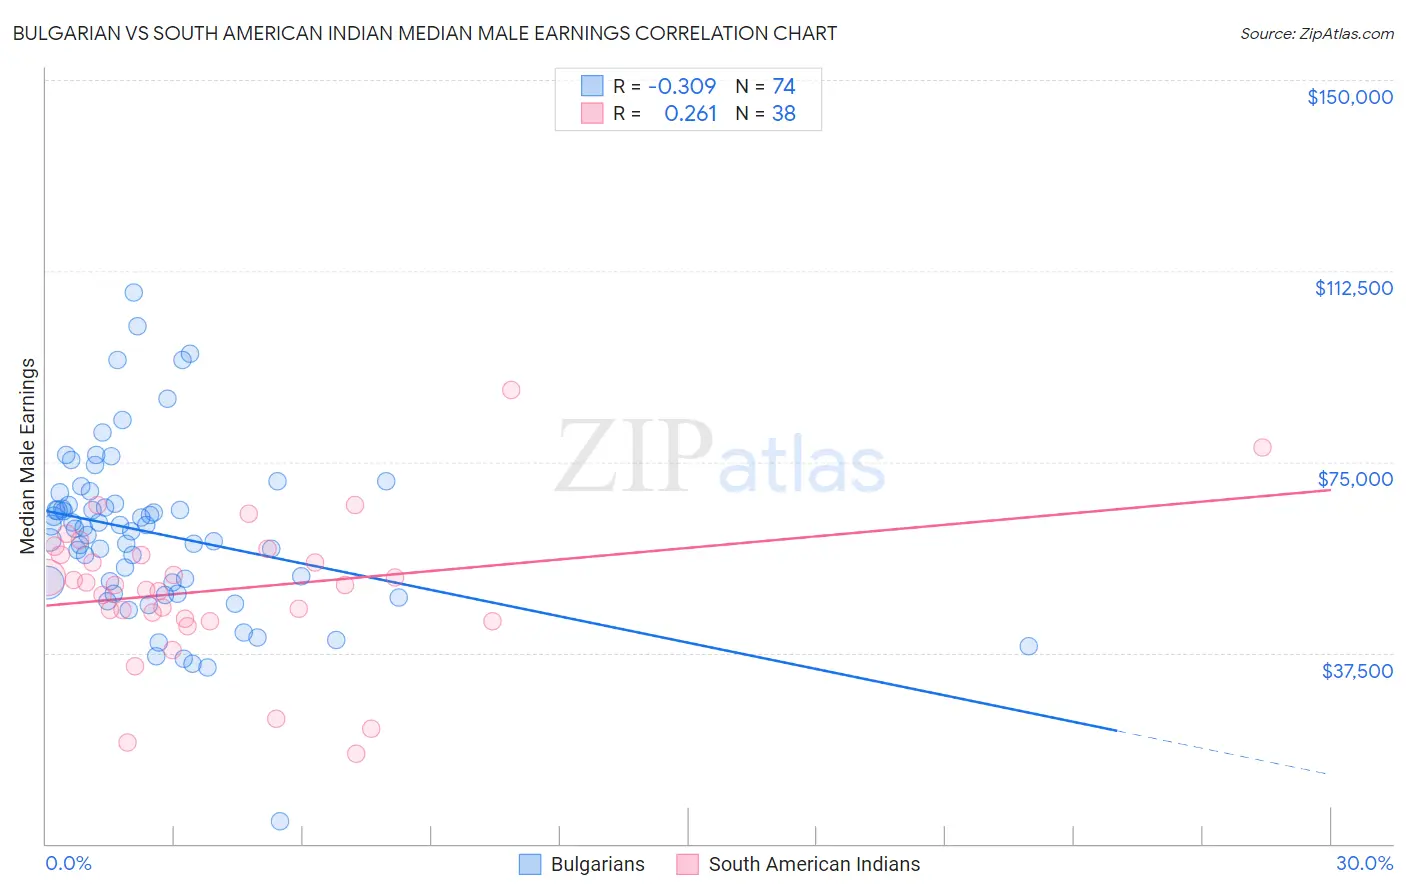
Bulgarian vs South American Indian Median Male Earnings Correlation Chart
The statistical analysis conducted on geographies consisting of 205,598,511 people shows a mild negative correlation between the proportion of Bulgarians and median male earnings in the United States with a correlation coefficient (R) of -0.309 and weighted average of $62,378. Similarly, the statistical analysis conducted on geographies consisting of 164,558,880 people shows a weak positive correlation between the proportion of South American Indians and median male earnings in the United States with a correlation coefficient (R) of 0.261 and weighted average of $54,508, a difference of 14.4%.
Median Male Earnings Correlation Summary
| Measurement | Bulgarian | South American Indian |
| Minimum | $4,447 | $17,560 |
| Maximum | $108,199 | $89,196 |
| Range | $103,752 | $71,636 |
| Mean | $60,992 | $49,938 |
| Median | $62,011 | $50,818 |
| Interquartile 25% (IQ1) | $51,254 | $44,221 |
| Interquartile 75% (IQ3) | $66,727 | $56,795 |
| Interquartile Range (IQR) | $15,473 | $12,575 |
| Standard Deviation (Sample) | $16,836 | $14,312 |
| Standard Deviation (Population) | $16,722 | $14,122 |
Similar Demographics by Median Male Earnings
Demographics Similar to Bulgarians by Median Male Earnings
In terms of median male earnings, the demographic groups most similar to Bulgarians are Cambodian ($62,516, a difference of 0.22%), Immigrants from Czechoslovakia ($62,217, a difference of 0.26%), Immigrants from Austria ($62,164, a difference of 0.35%), Immigrants from Malaysia ($62,121, a difference of 0.41%), and Immigrants from Belarus ($62,658, a difference of 0.45%).
| Demographics | Rating | Rank | Median Male Earnings |
| Maltese | 100.0 /100 | #38 | Exceptional $62,953 |
| Immigrants | South Africa | 100.0 /100 | #39 | Exceptional $62,899 |
| Australians | 100.0 /100 | #40 | Exceptional $62,857 |
| Immigrants | Turkey | 100.0 /100 | #41 | Exceptional $62,728 |
| Immigrants | Greece | 100.0 /100 | #42 | Exceptional $62,689 |
| Immigrants | Belarus | 100.0 /100 | #43 | Exceptional $62,658 |
| Cambodians | 100.0 /100 | #44 | Exceptional $62,516 |
| Bulgarians | 100.0 /100 | #45 | Exceptional $62,378 |
| Immigrants | Czechoslovakia | 99.9 /100 | #46 | Exceptional $62,217 |
| Immigrants | Austria | 99.9 /100 | #47 | Exceptional $62,164 |
| Immigrants | Malaysia | 99.9 /100 | #48 | Exceptional $62,121 |
| Immigrants | Europe | 99.9 /100 | #49 | Exceptional $62,057 |
| Bhutanese | 99.9 /100 | #50 | Exceptional $61,759 |
| Estonians | 99.9 /100 | #51 | Exceptional $61,710 |
| Immigrants | Norway | 99.9 /100 | #52 | Exceptional $61,628 |
Demographics Similar to South American Indians by Median Male Earnings
In terms of median male earnings, the demographic groups most similar to South American Indians are South American ($54,492, a difference of 0.030%), Dutch ($54,410, a difference of 0.18%), Spaniard ($54,401, a difference of 0.20%), Welsh ($54,647, a difference of 0.25%), and Immigrants from Peru ($54,695, a difference of 0.34%).
| Demographics | Rating | Rank | Median Male Earnings |
| Germans | 61.6 /100 | #166 | Good $54,974 |
| Immigrants | Fiji | 61.2 /100 | #167 | Good $54,958 |
| Immigrants | Vietnam | 60.2 /100 | #168 | Good $54,913 |
| French Canadians | 55.6 /100 | #169 | Average $54,722 |
| Finns | 55.6 /100 | #170 | Average $54,721 |
| Immigrants | Peru | 54.9 /100 | #171 | Average $54,695 |
| Welsh | 53.8 /100 | #172 | Average $54,647 |
| South American Indians | 50.4 /100 | #173 | Average $54,508 |
| South Americans | 50.0 /100 | #174 | Average $54,492 |
| Dutch | 48.0 /100 | #175 | Average $54,410 |
| Spaniards | 47.8 /100 | #176 | Average $54,401 |
| Costa Ricans | 44.8 /100 | #177 | Average $54,279 |
| Sierra Leoneans | 44.8 /100 | #178 | Average $54,279 |
| Celtics | 43.9 /100 | #179 | Average $54,242 |
| Iraqis | 42.5 /100 | #180 | Average $54,182 |