Inupiat vs Immigrants from Korea Median Male Earnings
COMPARE
Inupiat
Immigrants from Korea
Median Male Earnings
Median Male Earnings Comparison
Inupiat
Immigrants from Korea
$47,281
MEDIAN MALE EARNINGS
0.1/ 100
METRIC RATING
296th/ 347
METRIC RANK
$65,079
MEDIAN MALE EARNINGS
100.0/ 100
METRIC RATING
23rd/ 347
METRIC RANK
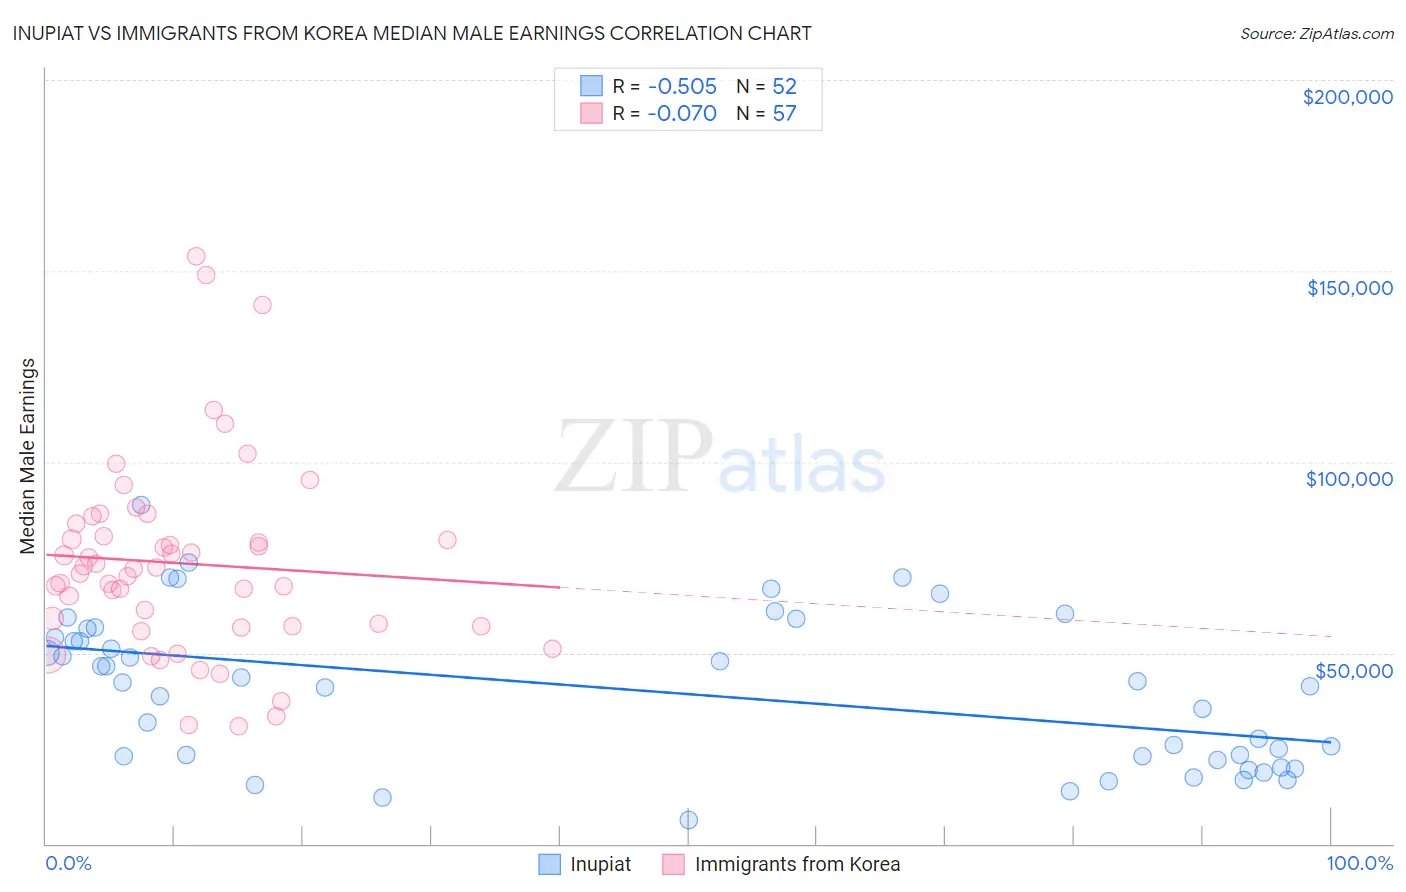
Inupiat vs Immigrants from Korea Median Male Earnings Correlation Chart
The statistical analysis conducted on geographies consisting of 96,323,006 people shows a substantial negative correlation between the proportion of Inupiat and median male earnings in the United States with a correlation coefficient (R) of -0.505 and weighted average of $47,281. Similarly, the statistical analysis conducted on geographies consisting of 416,203,155 people shows a slight negative correlation between the proportion of Immigrants from Korea and median male earnings in the United States with a correlation coefficient (R) of -0.070 and weighted average of $65,079, a difference of 37.7%.
Median Male Earnings Correlation Summary
| Measurement | Inupiat | Immigrants from Korea |
| Minimum | $6,250 | $30,795 |
| Maximum | $88,594 | $153,870 |
| Range | $82,344 | $123,075 |
| Mean | $40,024 | $73,429 |
| Median | $41,688 | $71,921 |
| Interquartile 25% (IQ1) | $22,499 | $56,978 |
| Interquartile 75% (IQ3) | $55,179 | $82,188 |
| Interquartile Range (IQR) | $32,680 | $25,211 |
| Standard Deviation (Sample) | $19,878 | $25,444 |
| Standard Deviation (Population) | $19,686 | $25,220 |
Similar Demographics by Median Male Earnings
Demographics Similar to Inupiat by Median Male Earnings
In terms of median male earnings, the demographic groups most similar to Inupiat are Dominican ($47,204, a difference of 0.16%), Immigrants from Micronesia ($47,177, a difference of 0.22%), Central American Indian ($47,433, a difference of 0.32%), Immigrants from Nicaragua ($47,482, a difference of 0.43%), and Immigrants from Zaire ($47,070, a difference of 0.45%).
| Demographics | Rating | Rank | Median Male Earnings |
| Chickasaw | 0.1 /100 | #289 | Tragic $47,832 |
| Immigrants | Belize | 0.1 /100 | #290 | Tragic $47,809 |
| Choctaw | 0.1 /100 | #291 | Tragic $47,729 |
| Immigrants | Dominica | 0.1 /100 | #292 | Tragic $47,651 |
| Indonesians | 0.1 /100 | #293 | Tragic $47,503 |
| Immigrants | Nicaragua | 0.1 /100 | #294 | Tragic $47,482 |
| Central American Indians | 0.1 /100 | #295 | Tragic $47,433 |
| Inupiat | 0.1 /100 | #296 | Tragic $47,281 |
| Dominicans | 0.1 /100 | #297 | Tragic $47,204 |
| Immigrants | Micronesia | 0.1 /100 | #298 | Tragic $47,177 |
| Immigrants | Zaire | 0.1 /100 | #299 | Tragic $47,070 |
| U.S. Virgin Islanders | 0.1 /100 | #300 | Tragic $47,066 |
| Immigrants | Latin America | 0.1 /100 | #301 | Tragic $46,941 |
| Seminole | 0.1 /100 | #302 | Tragic $46,783 |
| Yaqui | 0.1 /100 | #303 | Tragic $46,777 |
Demographics Similar to Immigrants from Korea by Median Male Earnings
In terms of median male earnings, the demographic groups most similar to Immigrants from Korea are Immigrants from Northern Europe ($64,987, a difference of 0.14%), Burmese ($65,236, a difference of 0.24%), Immigrants from Sweden ($65,406, a difference of 0.50%), Immigrants from Japan ($65,518, a difference of 0.67%), and Immigrants from Denmark ($64,625, a difference of 0.70%).
| Demographics | Rating | Rank | Median Male Earnings |
| Eastern Europeans | 100.0 /100 | #16 | Exceptional $66,472 |
| Immigrants | Belgium | 100.0 /100 | #17 | Exceptional $66,125 |
| Indians (Asian) | 100.0 /100 | #18 | Exceptional $66,078 |
| Cypriots | 100.0 /100 | #19 | Exceptional $65,549 |
| Immigrants | Japan | 100.0 /100 | #20 | Exceptional $65,518 |
| Immigrants | Sweden | 100.0 /100 | #21 | Exceptional $65,406 |
| Burmese | 100.0 /100 | #22 | Exceptional $65,236 |
| Immigrants | Korea | 100.0 /100 | #23 | Exceptional $65,079 |
| Immigrants | Northern Europe | 100.0 /100 | #24 | Exceptional $64,987 |
| Immigrants | Denmark | 100.0 /100 | #25 | Exceptional $64,625 |
| Turks | 100.0 /100 | #26 | Exceptional $64,253 |
| Immigrants | Switzerland | 100.0 /100 | #27 | Exceptional $63,944 |
| Russians | 100.0 /100 | #28 | Exceptional $63,939 |
| Asians | 100.0 /100 | #29 | Exceptional $63,827 |
| Immigrants | France | 100.0 /100 | #30 | Exceptional $63,715 |