Creek vs South American Indian Median Male Earnings
COMPARE
Creek
South American Indian
Median Male Earnings
Median Male Earnings Comparison
Creek
South American Indians
$46,594
MEDIAN MALE EARNINGS
0.0/ 100
METRIC RATING
309th/ 347
METRIC RANK
$54,508
MEDIAN MALE EARNINGS
50.4/ 100
METRIC RATING
173rd/ 347
METRIC RANK
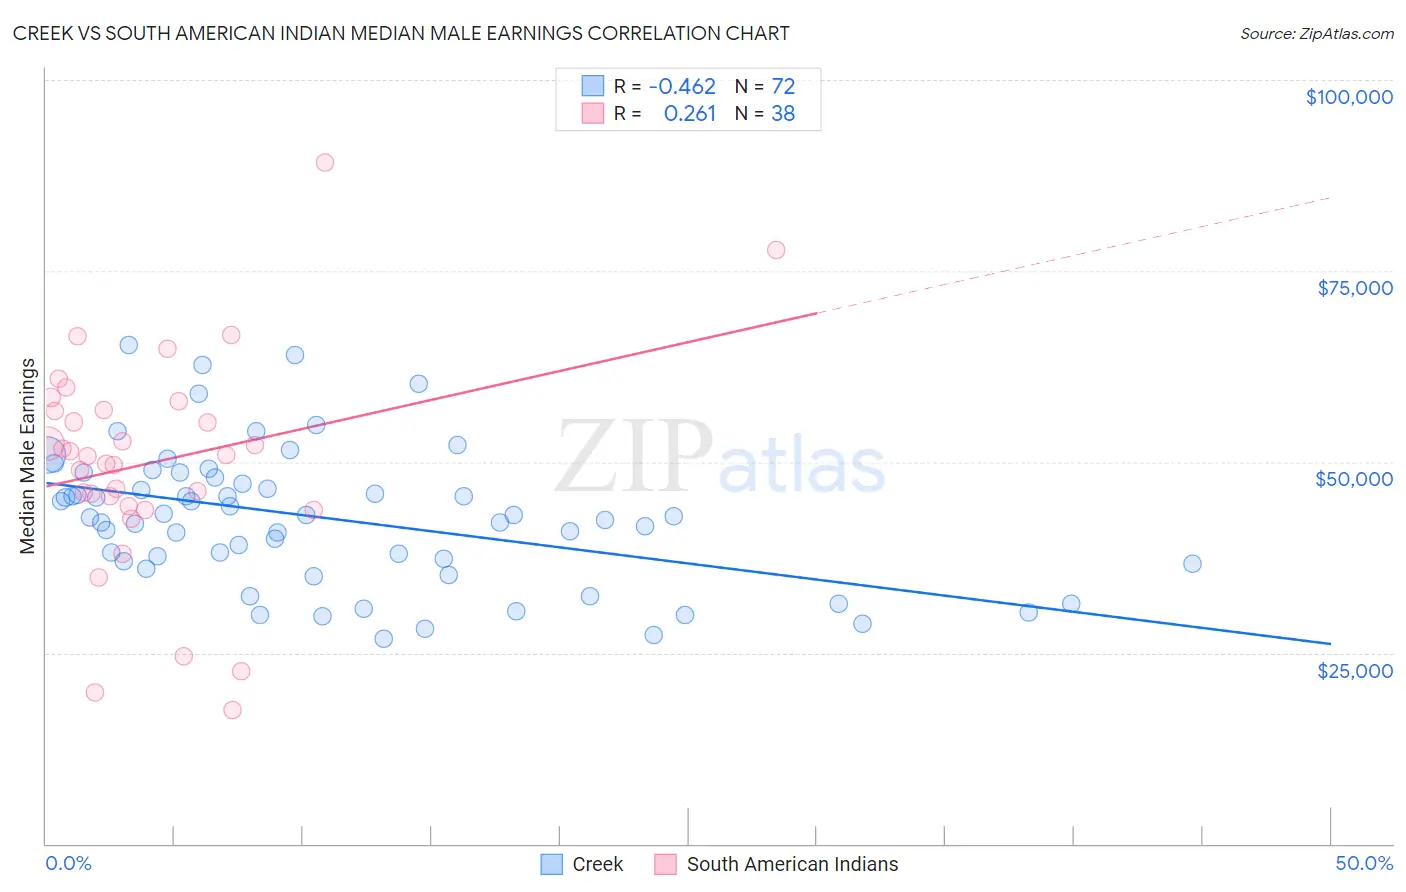
Creek vs South American Indian Median Male Earnings Correlation Chart
The statistical analysis conducted on geographies consisting of 178,430,593 people shows a moderate negative correlation between the proportion of Creek and median male earnings in the United States with a correlation coefficient (R) of -0.462 and weighted average of $46,594. Similarly, the statistical analysis conducted on geographies consisting of 164,558,880 people shows a weak positive correlation between the proportion of South American Indians and median male earnings in the United States with a correlation coefficient (R) of 0.261 and weighted average of $54,508, a difference of 17.0%.
Median Male Earnings Correlation Summary
| Measurement | Creek | South American Indian |
| Minimum | $26,855 | $17,560 |
| Maximum | $65,299 | $89,196 |
| Range | $38,444 | $71,636 |
| Mean | $42,595 | $49,938 |
| Median | $42,837 | $50,818 |
| Interquartile 25% (IQ1) | $36,835 | $44,221 |
| Interquartile 75% (IQ3) | $47,588 | $56,795 |
| Interquartile Range (IQR) | $10,753 | $12,575 |
| Standard Deviation (Sample) | $8,932 | $14,312 |
| Standard Deviation (Population) | $8,870 | $14,122 |
Similar Demographics by Median Male Earnings
Demographics Similar to Creek by Median Male Earnings
In terms of median male earnings, the demographic groups most similar to Creek are Cuban ($46,580, a difference of 0.030%), Ottawa ($46,611, a difference of 0.040%), Dutch West Indian ($46,656, a difference of 0.13%), Immigrants from Dominican Republic ($46,655, a difference of 0.13%), and Guatemalan ($46,736, a difference of 0.30%).
| Demographics | Rating | Rank | Median Male Earnings |
| Seminole | 0.1 /100 | #302 | Tragic $46,783 |
| Yaqui | 0.1 /100 | #303 | Tragic $46,777 |
| Bangladeshis | 0.1 /100 | #304 | Tragic $46,744 |
| Guatemalans | 0.0 /100 | #305 | Tragic $46,736 |
| Dutch West Indians | 0.0 /100 | #306 | Tragic $46,656 |
| Immigrants | Dominican Republic | 0.0 /100 | #307 | Tragic $46,655 |
| Ottawa | 0.0 /100 | #308 | Tragic $46,611 |
| Creek | 0.0 /100 | #309 | Tragic $46,594 |
| Cubans | 0.0 /100 | #310 | Tragic $46,580 |
| Apache | 0.0 /100 | #311 | Tragic $46,429 |
| Hispanics or Latinos | 0.0 /100 | #312 | Tragic $46,419 |
| Hondurans | 0.0 /100 | #313 | Tragic $46,374 |
| Chippewa | 0.0 /100 | #314 | Tragic $46,368 |
| Immigrants | Guatemala | 0.0 /100 | #315 | Tragic $46,244 |
| Immigrants | Caribbean | 0.0 /100 | #316 | Tragic $46,193 |
Demographics Similar to South American Indians by Median Male Earnings
In terms of median male earnings, the demographic groups most similar to South American Indians are South American ($54,492, a difference of 0.030%), Dutch ($54,410, a difference of 0.18%), Spaniard ($54,401, a difference of 0.20%), Welsh ($54,647, a difference of 0.25%), and Immigrants from Peru ($54,695, a difference of 0.34%).
| Demographics | Rating | Rank | Median Male Earnings |
| Germans | 61.6 /100 | #166 | Good $54,974 |
| Immigrants | Fiji | 61.2 /100 | #167 | Good $54,958 |
| Immigrants | Vietnam | 60.2 /100 | #168 | Good $54,913 |
| French Canadians | 55.6 /100 | #169 | Average $54,722 |
| Finns | 55.6 /100 | #170 | Average $54,721 |
| Immigrants | Peru | 54.9 /100 | #171 | Average $54,695 |
| Welsh | 53.8 /100 | #172 | Average $54,647 |
| South American Indians | 50.4 /100 | #173 | Average $54,508 |
| South Americans | 50.0 /100 | #174 | Average $54,492 |
| Dutch | 48.0 /100 | #175 | Average $54,410 |
| Spaniards | 47.8 /100 | #176 | Average $54,401 |
| Costa Ricans | 44.8 /100 | #177 | Average $54,279 |
| Sierra Leoneans | 44.8 /100 | #178 | Average $54,279 |
| Celtics | 43.9 /100 | #179 | Average $54,242 |
| Iraqis | 42.5 /100 | #180 | Average $54,182 |