Inupiat vs Immigrants from Ghana Median Male Earnings
COMPARE
Inupiat
Immigrants from Ghana
Median Male Earnings
Median Male Earnings Comparison
Inupiat
Immigrants from Ghana
$47,281
MEDIAN MALE EARNINGS
0.1/ 100
METRIC RATING
296th/ 347
METRIC RANK
$51,836
MEDIAN MALE EARNINGS
6.9/ 100
METRIC RATING
219th/ 347
METRIC RANK
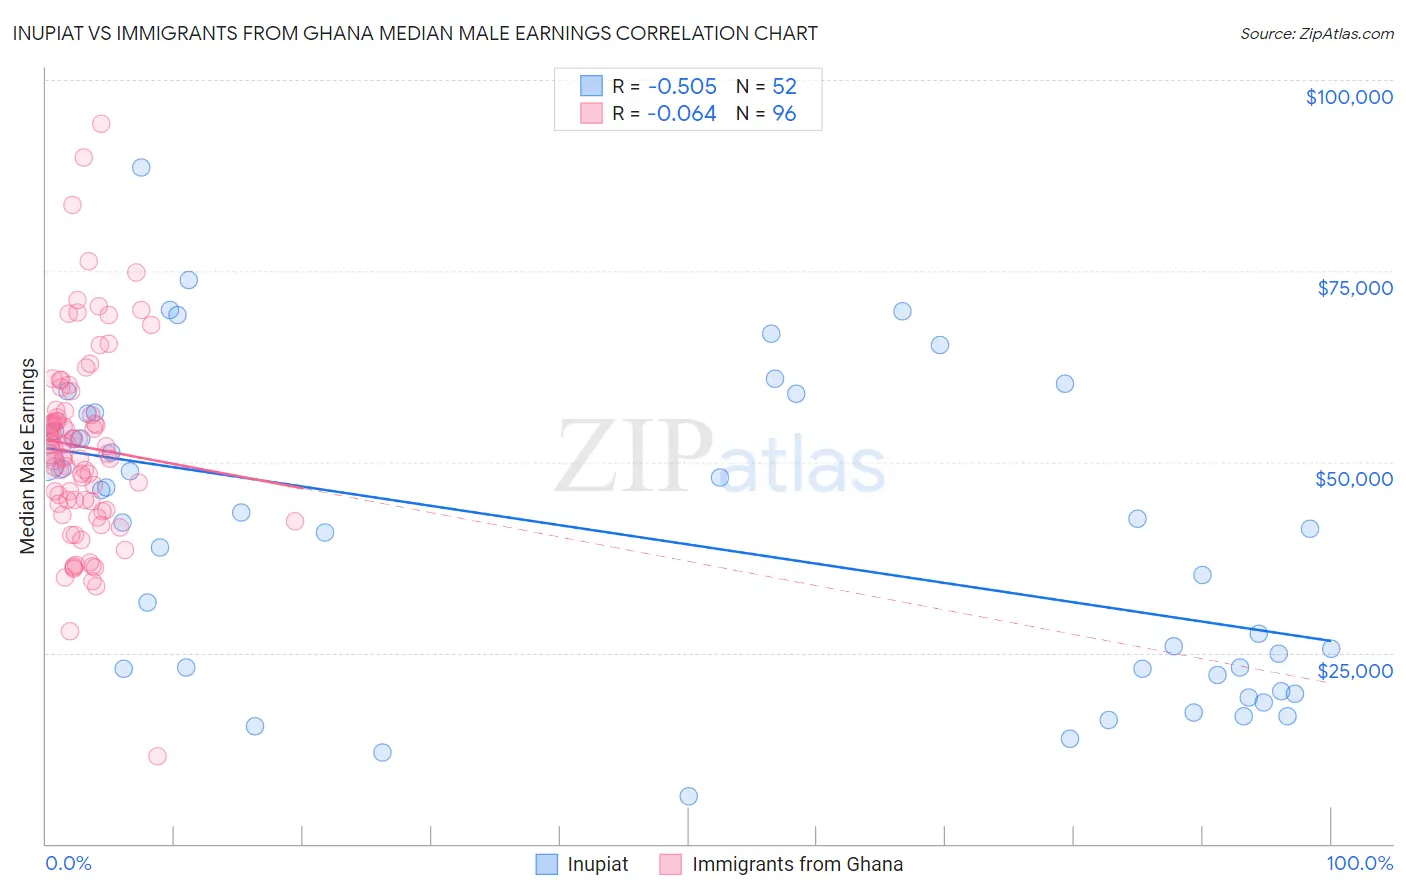
Inupiat vs Immigrants from Ghana Median Male Earnings Correlation Chart
The statistical analysis conducted on geographies consisting of 96,323,006 people shows a substantial negative correlation between the proportion of Inupiat and median male earnings in the United States with a correlation coefficient (R) of -0.505 and weighted average of $47,281. Similarly, the statistical analysis conducted on geographies consisting of 199,928,244 people shows a slight negative correlation between the proportion of Immigrants from Ghana and median male earnings in the United States with a correlation coefficient (R) of -0.064 and weighted average of $51,836, a difference of 9.6%.
Median Male Earnings Correlation Summary
| Measurement | Inupiat | Immigrants from Ghana |
| Minimum | $6,250 | $11,405 |
| Maximum | $88,594 | $94,205 |
| Range | $82,344 | $82,800 |
| Mean | $40,024 | $52,017 |
| Median | $41,688 | $51,835 |
| Interquartile 25% (IQ1) | $22,499 | $44,651 |
| Interquartile 75% (IQ3) | $55,179 | $56,389 |
| Interquartile Range (IQR) | $32,680 | $11,739 |
| Standard Deviation (Sample) | $19,878 | $12,685 |
| Standard Deviation (Population) | $19,686 | $12,619 |
Similar Demographics by Median Male Earnings
Demographics Similar to Inupiat by Median Male Earnings
In terms of median male earnings, the demographic groups most similar to Inupiat are Dominican ($47,204, a difference of 0.16%), Immigrants from Micronesia ($47,177, a difference of 0.22%), Central American Indian ($47,433, a difference of 0.32%), Immigrants from Nicaragua ($47,482, a difference of 0.43%), and Immigrants from Zaire ($47,070, a difference of 0.45%).
| Demographics | Rating | Rank | Median Male Earnings |
| Chickasaw | 0.1 /100 | #289 | Tragic $47,832 |
| Immigrants | Belize | 0.1 /100 | #290 | Tragic $47,809 |
| Choctaw | 0.1 /100 | #291 | Tragic $47,729 |
| Immigrants | Dominica | 0.1 /100 | #292 | Tragic $47,651 |
| Indonesians | 0.1 /100 | #293 | Tragic $47,503 |
| Immigrants | Nicaragua | 0.1 /100 | #294 | Tragic $47,482 |
| Central American Indians | 0.1 /100 | #295 | Tragic $47,433 |
| Inupiat | 0.1 /100 | #296 | Tragic $47,281 |
| Dominicans | 0.1 /100 | #297 | Tragic $47,204 |
| Immigrants | Micronesia | 0.1 /100 | #298 | Tragic $47,177 |
| Immigrants | Zaire | 0.1 /100 | #299 | Tragic $47,070 |
| U.S. Virgin Islanders | 0.1 /100 | #300 | Tragic $47,066 |
| Immigrants | Latin America | 0.1 /100 | #301 | Tragic $46,941 |
| Seminole | 0.1 /100 | #302 | Tragic $46,783 |
| Yaqui | 0.1 /100 | #303 | Tragic $46,777 |
Demographics Similar to Immigrants from Ghana by Median Male Earnings
In terms of median male earnings, the demographic groups most similar to Immigrants from Ghana are Immigrants from Armenia ($51,793, a difference of 0.080%), Immigrants from Panama ($51,962, a difference of 0.24%), Immigrants from Senegal ($51,647, a difference of 0.37%), Immigrants from Bangladesh ($51,642, a difference of 0.38%), and Nigerian ($52,039, a difference of 0.39%).
| Demographics | Rating | Rank | Median Male Earnings |
| Cajuns | 10.7 /100 | #212 | Poor $52,325 |
| Native Hawaiians | 10.5 /100 | #213 | Poor $52,306 |
| Immigrants | Nonimmigrants | 9.3 /100 | #214 | Tragic $52,170 |
| Immigrants | Cameroon | 8.9 /100 | #215 | Tragic $52,119 |
| Immigrants | Venezuela | 8.3 /100 | #216 | Tragic $52,041 |
| Nigerians | 8.3 /100 | #217 | Tragic $52,039 |
| Immigrants | Panama | 7.7 /100 | #218 | Tragic $51,962 |
| Immigrants | Ghana | 6.9 /100 | #219 | Tragic $51,836 |
| Immigrants | Armenia | 6.6 /100 | #220 | Tragic $51,793 |
| Immigrants | Senegal | 5.8 /100 | #221 | Tragic $51,647 |
| Immigrants | Bangladesh | 5.8 /100 | #222 | Tragic $51,642 |
| Ecuadorians | 5.5 /100 | #223 | Tragic $51,596 |
| Immigrants | Cambodia | 5.5 /100 | #224 | Tragic $51,594 |
| Immigrants | Sudan | 5.0 /100 | #225 | Tragic $51,489 |
| Japanese | 4.9 /100 | #226 | Tragic $51,473 |