Burmese vs South American Indian Median Male Earnings
COMPARE
Burmese
South American Indian
Median Male Earnings
Median Male Earnings Comparison
Burmese
South American Indians
$65,236
MEDIAN MALE EARNINGS
100.0/ 100
METRIC RATING
22nd/ 347
METRIC RANK
$54,508
MEDIAN MALE EARNINGS
50.4/ 100
METRIC RATING
173rd/ 347
METRIC RANK
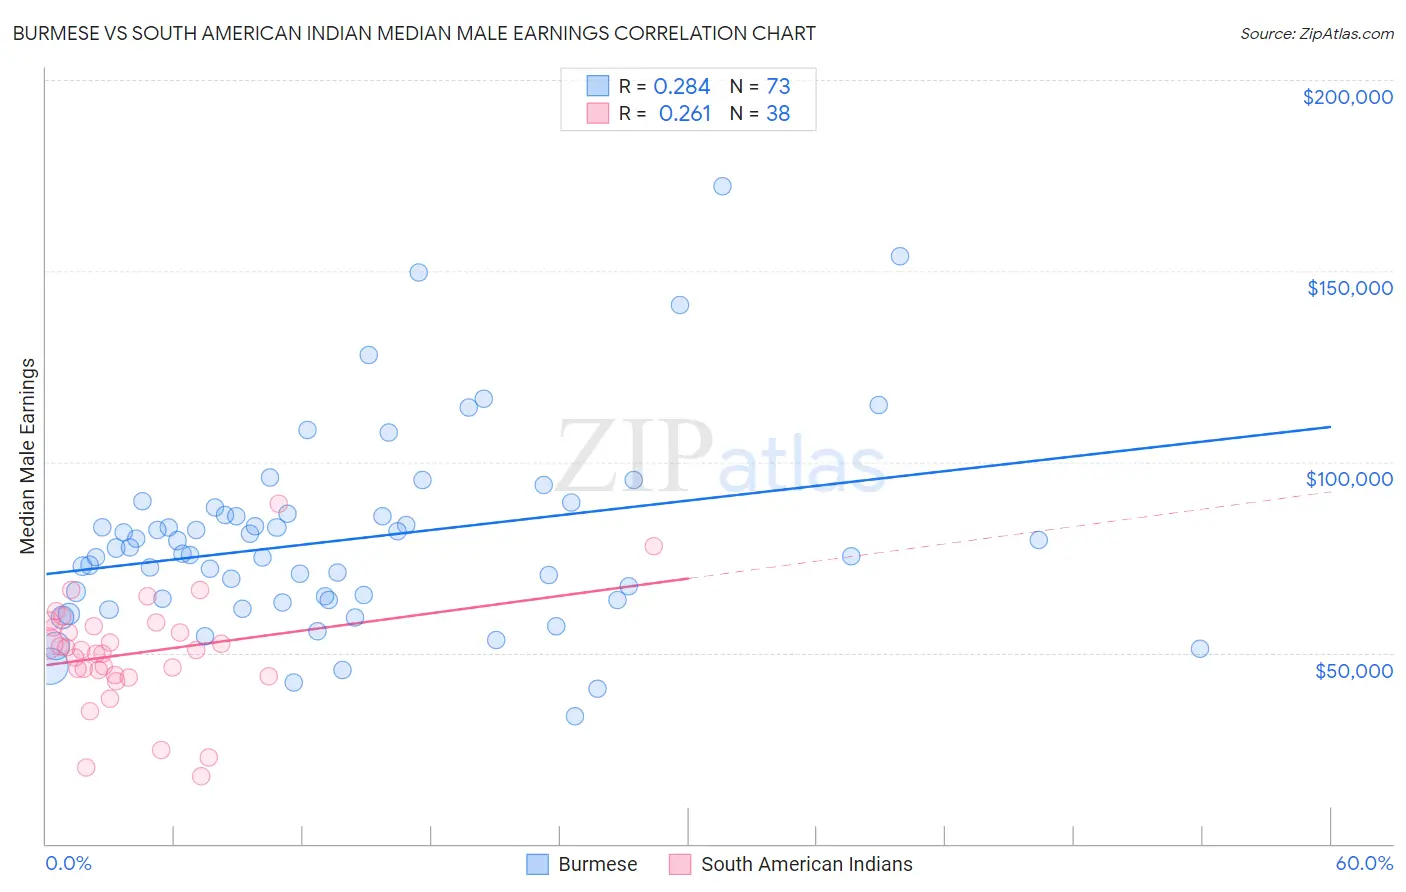
Burmese vs South American Indian Median Male Earnings Correlation Chart
The statistical analysis conducted on geographies consisting of 465,224,564 people shows a weak positive correlation between the proportion of Burmese and median male earnings in the United States with a correlation coefficient (R) of 0.284 and weighted average of $65,236. Similarly, the statistical analysis conducted on geographies consisting of 164,558,880 people shows a weak positive correlation between the proportion of South American Indians and median male earnings in the United States with a correlation coefficient (R) of 0.261 and weighted average of $54,508, a difference of 19.7%.
Median Male Earnings Correlation Summary
| Measurement | Burmese | South American Indian |
| Minimum | $33,399 | $17,560 |
| Maximum | $172,143 | $89,196 |
| Range | $138,744 | $71,636 |
| Mean | $79,644 | $49,938 |
| Median | $75,943 | $50,818 |
| Interquartile 25% (IQ1) | $63,717 | $44,221 |
| Interquartile 75% (IQ3) | $86,383 | $56,795 |
| Interquartile Range (IQR) | $22,666 | $12,575 |
| Standard Deviation (Sample) | $25,713 | $14,312 |
| Standard Deviation (Population) | $25,536 | $14,122 |
Similar Demographics by Median Male Earnings
Demographics Similar to Burmese by Median Male Earnings
In terms of median male earnings, the demographic groups most similar to Burmese are Immigrants from Korea ($65,079, a difference of 0.24%), Immigrants from Sweden ($65,406, a difference of 0.26%), Immigrants from Northern Europe ($64,987, a difference of 0.38%), Immigrants from Japan ($65,518, a difference of 0.43%), and Cypriot ($65,549, a difference of 0.48%).
| Demographics | Rating | Rank | Median Male Earnings |
| Immigrants | Eastern Asia | 100.0 /100 | #15 | Exceptional $66,903 |
| Eastern Europeans | 100.0 /100 | #16 | Exceptional $66,472 |
| Immigrants | Belgium | 100.0 /100 | #17 | Exceptional $66,125 |
| Indians (Asian) | 100.0 /100 | #18 | Exceptional $66,078 |
| Cypriots | 100.0 /100 | #19 | Exceptional $65,549 |
| Immigrants | Japan | 100.0 /100 | #20 | Exceptional $65,518 |
| Immigrants | Sweden | 100.0 /100 | #21 | Exceptional $65,406 |
| Burmese | 100.0 /100 | #22 | Exceptional $65,236 |
| Immigrants | Korea | 100.0 /100 | #23 | Exceptional $65,079 |
| Immigrants | Northern Europe | 100.0 /100 | #24 | Exceptional $64,987 |
| Immigrants | Denmark | 100.0 /100 | #25 | Exceptional $64,625 |
| Turks | 100.0 /100 | #26 | Exceptional $64,253 |
| Immigrants | Switzerland | 100.0 /100 | #27 | Exceptional $63,944 |
| Russians | 100.0 /100 | #28 | Exceptional $63,939 |
| Asians | 100.0 /100 | #29 | Exceptional $63,827 |
Demographics Similar to South American Indians by Median Male Earnings
In terms of median male earnings, the demographic groups most similar to South American Indians are South American ($54,492, a difference of 0.030%), Dutch ($54,410, a difference of 0.18%), Spaniard ($54,401, a difference of 0.20%), Welsh ($54,647, a difference of 0.25%), and Immigrants from Peru ($54,695, a difference of 0.34%).
| Demographics | Rating | Rank | Median Male Earnings |
| Germans | 61.6 /100 | #166 | Good $54,974 |
| Immigrants | Fiji | 61.2 /100 | #167 | Good $54,958 |
| Immigrants | Vietnam | 60.2 /100 | #168 | Good $54,913 |
| French Canadians | 55.6 /100 | #169 | Average $54,722 |
| Finns | 55.6 /100 | #170 | Average $54,721 |
| Immigrants | Peru | 54.9 /100 | #171 | Average $54,695 |
| Welsh | 53.8 /100 | #172 | Average $54,647 |
| South American Indians | 50.4 /100 | #173 | Average $54,508 |
| South Americans | 50.0 /100 | #174 | Average $54,492 |
| Dutch | 48.0 /100 | #175 | Average $54,410 |
| Spaniards | 47.8 /100 | #176 | Average $54,401 |
| Costa Ricans | 44.8 /100 | #177 | Average $54,279 |
| Sierra Leoneans | 44.8 /100 | #178 | Average $54,279 |
| Celtics | 43.9 /100 | #179 | Average $54,242 |
| Iraqis | 42.5 /100 | #180 | Average $54,182 |