Immigrants from Belize vs Immigrants from Sweden Wage/Income Gap
COMPARE
Immigrants from Belize
Immigrants from Sweden
Wage/Income Gap
Wage/Income Gap Comparison
Immigrants from Belize
Immigrants from Sweden
21.3%
WAGE/INCOME GAP
100.0/ 100
METRIC RATING
38th/ 347
METRIC RANK
28.1%
WAGE/INCOME GAP
0.4/ 100
METRIC RATING
284th/ 347
METRIC RANK
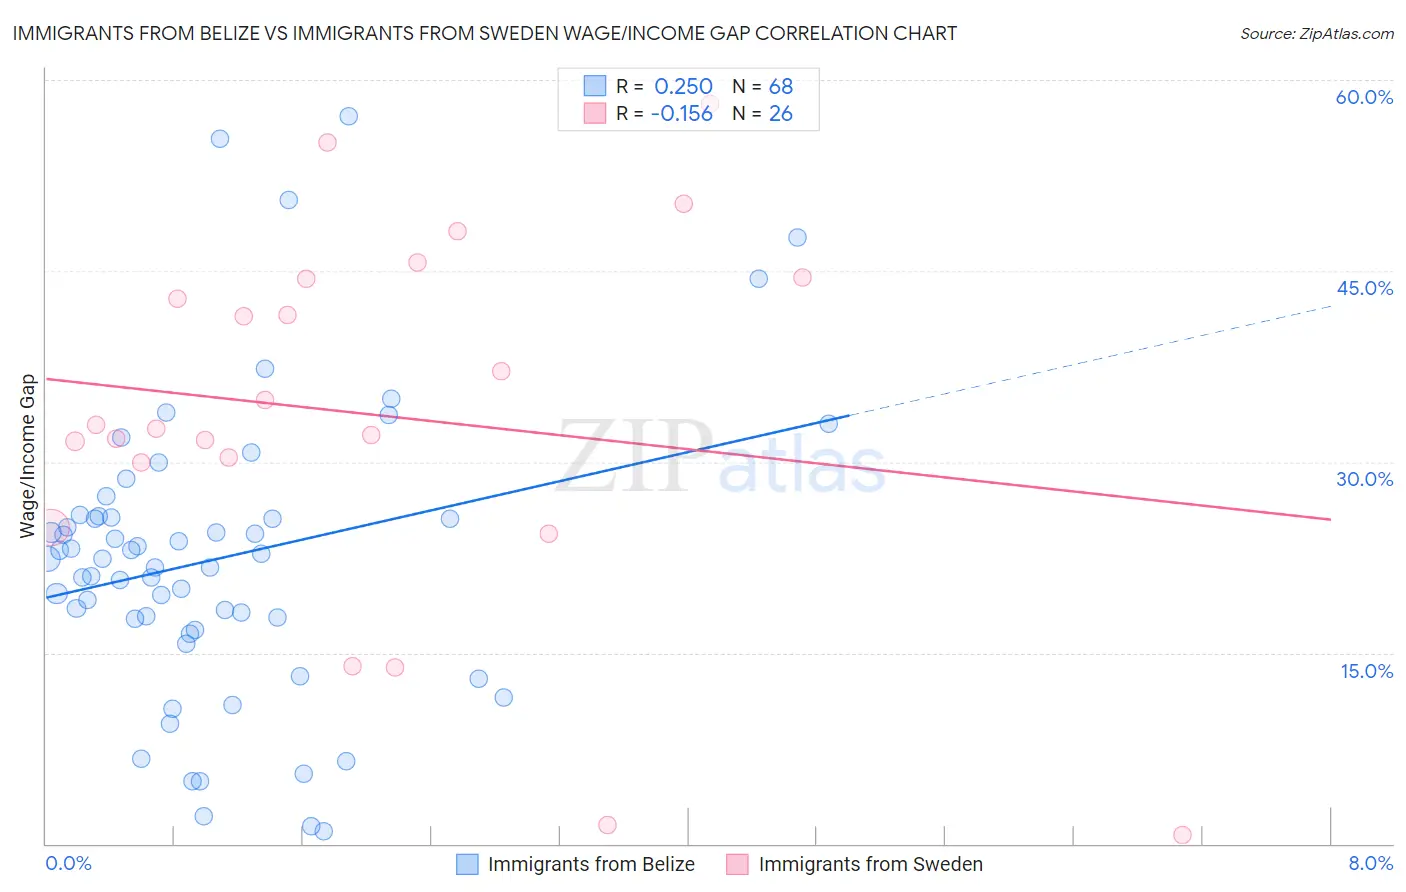
Immigrants from Belize vs Immigrants from Sweden Wage/Income Gap Correlation Chart
The statistical analysis conducted on geographies consisting of 130,310,260 people shows a weak positive correlation between the proportion of Immigrants from Belize and wage/income gap percentage in the United States with a correlation coefficient (R) of 0.250 and weighted average of 21.3%. Similarly, the statistical analysis conducted on geographies consisting of 164,690,992 people shows a poor negative correlation between the proportion of Immigrants from Sweden and wage/income gap percentage in the United States with a correlation coefficient (R) of -0.156 and weighted average of 28.1%, a difference of 32.1%.
Wage/Income Gap Correlation Summary
| Measurement | Immigrants from Belize | Immigrants from Sweden |
| Minimum | 0.94% | 0.69% |
| Maximum | 57.2% | 58.2% |
| Range | 56.2% | 57.5% |
| Mean | 22.4% | 33.7% |
| Median | 22.4% | 32.8% |
| Interquartile 25% (IQ1) | 17.3% | 30.0% |
| Interquartile 75% (IQ3) | 25.7% | 44.4% |
| Interquartile Range (IQR) | 8.4% | 14.4% |
| Standard Deviation (Sample) | 11.6% | 14.5% |
| Standard Deviation (Population) | 11.5% | 14.2% |
Similar Demographics by Wage/Income Gap
Demographics Similar to Immigrants from Belize by Wage/Income Gap
In terms of wage/income gap, the demographic groups most similar to Immigrants from Belize are Immigrants from Somalia (21.2%, a difference of 0.050%), Colville (21.3%, a difference of 0.11%), Belizean (21.2%, a difference of 0.12%), Somali (21.2%, a difference of 0.14%), and Lumbee (21.3%, a difference of 0.31%).
| Demographics | Rating | Rank | Wage/Income Gap |
| Vietnamese | 100.0 /100 | #31 | Exceptional 21.0% |
| Immigrants | Yemen | 100.0 /100 | #32 | Exceptional 21.1% |
| Immigrants | Bahamas | 100.0 /100 | #33 | Exceptional 21.1% |
| Pima | 100.0 /100 | #34 | Exceptional 21.1% |
| Somalis | 100.0 /100 | #35 | Exceptional 21.2% |
| Belizeans | 100.0 /100 | #36 | Exceptional 21.2% |
| Immigrants | Somalia | 100.0 /100 | #37 | Exceptional 21.2% |
| Immigrants | Belize | 100.0 /100 | #38 | Exceptional 21.3% |
| Colville | 100.0 /100 | #39 | Exceptional 21.3% |
| Lumbee | 100.0 /100 | #40 | Exceptional 21.3% |
| Liberians | 100.0 /100 | #41 | Exceptional 21.4% |
| Immigrants | Sierra Leone | 100.0 /100 | #42 | Exceptional 21.4% |
| Sierra Leoneans | 100.0 /100 | #43 | Exceptional 21.4% |
| Immigrants | Eritrea | 100.0 /100 | #44 | Exceptional 21.4% |
| U.S. Virgin Islanders | 100.0 /100 | #45 | Exceptional 21.5% |
Demographics Similar to Immigrants from Sweden by Wage/Income Gap
In terms of wage/income gap, the demographic groups most similar to Immigrants from Sweden are French Canadian (28.1%, a difference of 0.010%), Italian (28.1%, a difference of 0.13%), Immigrants from Austria (28.1%, a difference of 0.16%), South African (28.0%, a difference of 0.18%), and Okinawan (28.1%, a difference of 0.19%).
| Demographics | Rating | Rank | Wage/Income Gap |
| Latvians | 0.7 /100 | #277 | Tragic 27.9% |
| Immigrants | England | 0.6 /100 | #278 | Tragic 27.9% |
| Romanians | 0.5 /100 | #279 | Tragic 28.0% |
| Russians | 0.5 /100 | #280 | Tragic 28.0% |
| Burmese | 0.5 /100 | #281 | Tragic 28.0% |
| South Africans | 0.5 /100 | #282 | Tragic 28.0% |
| French Canadians | 0.4 /100 | #283 | Tragic 28.1% |
| Immigrants | Sweden | 0.4 /100 | #284 | Tragic 28.1% |
| Italians | 0.4 /100 | #285 | Tragic 28.1% |
| Immigrants | Austria | 0.4 /100 | #286 | Tragic 28.1% |
| Okinawans | 0.4 /100 | #287 | Tragic 28.1% |
| Choctaw | 0.4 /100 | #288 | Tragic 28.1% |
| Canadians | 0.3 /100 | #289 | Tragic 28.1% |
| Australians | 0.3 /100 | #290 | Tragic 28.2% |
| Czechoslovakians | 0.3 /100 | #291 | Tragic 28.2% |