Immigrants from Belize vs Immigrants from the Azores Wage/Income Gap
COMPARE
Immigrants from Belize
Immigrants from the Azores
Wage/Income Gap
Wage/Income Gap Comparison
Immigrants from Belize
Immigrants from the Azores
21.3%
WAGE/INCOME GAP
100.0/ 100
METRIC RATING
38th/ 347
METRIC RANK
27.2%
WAGE/INCOME GAP
3.5/ 100
METRIC RATING
245th/ 347
METRIC RANK
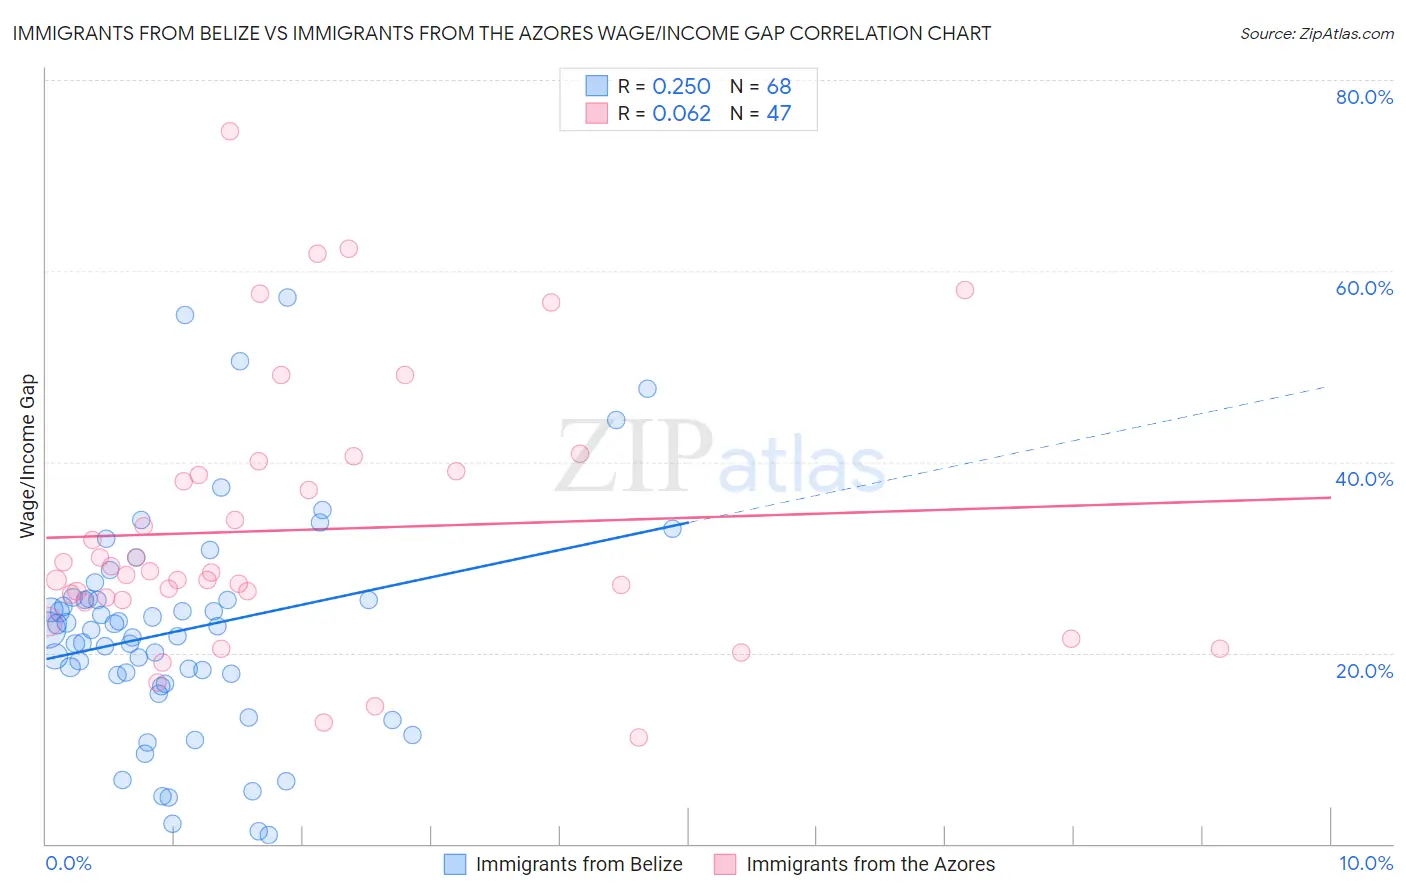
Immigrants from Belize vs Immigrants from the Azores Wage/Income Gap Correlation Chart
The statistical analysis conducted on geographies consisting of 130,310,260 people shows a weak positive correlation between the proportion of Immigrants from Belize and wage/income gap percentage in the United States with a correlation coefficient (R) of 0.250 and weighted average of 21.3%. Similarly, the statistical analysis conducted on geographies consisting of 46,247,590 people shows a slight positive correlation between the proportion of Immigrants from the Azores and wage/income gap percentage in the United States with a correlation coefficient (R) of 0.062 and weighted average of 27.2%, a difference of 27.8%.
Wage/Income Gap Correlation Summary
| Measurement | Immigrants from Belize | Immigrants from the Azores |
| Minimum | 0.94% | 11.1% |
| Maximum | 57.2% | 74.6% |
| Range | 56.2% | 63.5% |
| Mean | 22.4% | 32.9% |
| Median | 22.4% | 28.4% |
| Interquartile 25% (IQ1) | 17.3% | 25.6% |
| Interquartile 75% (IQ3) | 25.7% | 39.0% |
| Interquartile Range (IQR) | 8.4% | 13.4% |
| Standard Deviation (Sample) | 11.6% | 14.0% |
| Standard Deviation (Population) | 11.5% | 13.8% |
Similar Demographics by Wage/Income Gap
Demographics Similar to Immigrants from Belize by Wage/Income Gap
In terms of wage/income gap, the demographic groups most similar to Immigrants from Belize are Immigrants from Somalia (21.2%, a difference of 0.050%), Colville (21.3%, a difference of 0.11%), Belizean (21.2%, a difference of 0.12%), Somali (21.2%, a difference of 0.14%), and Lumbee (21.3%, a difference of 0.31%).
| Demographics | Rating | Rank | Wage/Income Gap |
| Vietnamese | 100.0 /100 | #31 | Exceptional 21.0% |
| Immigrants | Yemen | 100.0 /100 | #32 | Exceptional 21.1% |
| Immigrants | Bahamas | 100.0 /100 | #33 | Exceptional 21.1% |
| Pima | 100.0 /100 | #34 | Exceptional 21.1% |
| Somalis | 100.0 /100 | #35 | Exceptional 21.2% |
| Belizeans | 100.0 /100 | #36 | Exceptional 21.2% |
| Immigrants | Somalia | 100.0 /100 | #37 | Exceptional 21.2% |
| Immigrants | Belize | 100.0 /100 | #38 | Exceptional 21.3% |
| Colville | 100.0 /100 | #39 | Exceptional 21.3% |
| Lumbee | 100.0 /100 | #40 | Exceptional 21.3% |
| Liberians | 100.0 /100 | #41 | Exceptional 21.4% |
| Immigrants | Sierra Leone | 100.0 /100 | #42 | Exceptional 21.4% |
| Sierra Leoneans | 100.0 /100 | #43 | Exceptional 21.4% |
| Immigrants | Eritrea | 100.0 /100 | #44 | Exceptional 21.4% |
| U.S. Virgin Islanders | 100.0 /100 | #45 | Exceptional 21.5% |
Demographics Similar to Immigrants from the Azores by Wage/Income Gap
In terms of wage/income gap, the demographic groups most similar to Immigrants from the Azores are Chickasaw (27.2%, a difference of 0.020%), Nonimmigrants (27.2%, a difference of 0.080%), Immigrants from Sri Lanka (27.1%, a difference of 0.090%), Spanish (27.1%, a difference of 0.090%), and Creek (27.1%, a difference of 0.14%).
| Demographics | Rating | Rank | Wage/Income Gap |
| Osage | 4.4 /100 | #238 | Tragic 27.1% |
| Estonians | 4.3 /100 | #239 | Tragic 27.1% |
| Immigrants | Europe | 3.8 /100 | #240 | Tragic 27.1% |
| Creek | 3.8 /100 | #241 | Tragic 27.1% |
| Immigrants | Sri Lanka | 3.7 /100 | #242 | Tragic 27.1% |
| Spanish | 3.6 /100 | #243 | Tragic 27.1% |
| Chickasaw | 3.5 /100 | #244 | Tragic 27.2% |
| Immigrants | Azores | 3.5 /100 | #245 | Tragic 27.2% |
| Immigrants | Nonimmigrants | 3.3 /100 | #246 | Tragic 27.2% |
| Celtics | 2.8 /100 | #247 | Tragic 27.3% |
| Cypriots | 2.8 /100 | #248 | Tragic 27.3% |
| Carpatho Rusyns | 2.7 /100 | #249 | Tragic 27.3% |
| Immigrants | Czechoslovakia | 2.7 /100 | #250 | Tragic 27.3% |
| Immigrants | Norway | 2.5 /100 | #251 | Tragic 27.3% |
| Ukrainians | 2.4 /100 | #252 | Tragic 27.3% |